Introduction
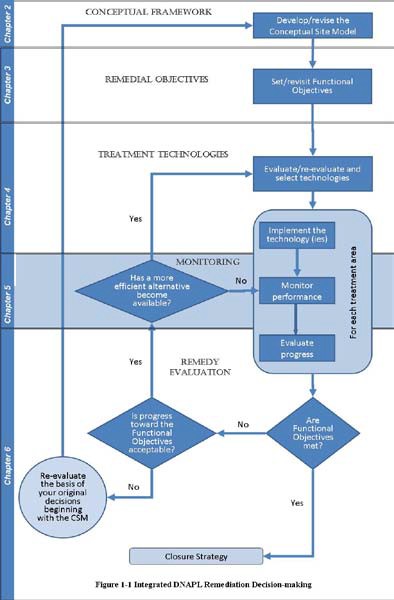
Development of an effective monitoring approach to evaluate progress towards achieving functional objectives is a critical element of an IDSS. As such, the monitoring approach must include a spatially and temporally sufficient and reliable data set measuring performance of the remedy. This chapter provides guidance and supporting material to assist the user in developing a monitoring approach that evaluates remedial performance toward SMART functional objectives. Useful related material includes USEPA 2005b and 2006
An IDSS monitoring program links elements of the remedial approach (e.g., technology estimated performance) against the measured performance and to the IDSS SMART functional objectives using performance metrics and a dynamic monitoring approach. A dynamic monitoring approach has the ability to adjust as data are added and analyzed against the current CSM (see Section 2). While easily stated, developing measurement metrics within the context of a SMART functional objective is difficult (see Section 3.2).
This chapter provides guidance for development of a monitoring approach at a chlorinated solvent–contaminated site. Section 5.1 describes three types of monitoring, Section 5.2 describes various media to be monitored, and Section 5.3 offers insight into alignment of data collection with SMART functional objectives. Section 5.4 describes the various metrics used in site monitoring, Section 5.5 describes methods used to evaluate monitoring data, and Section 5.6 discusses optimization of a site monitoring approach. Finally, Section 5.7 again visits the Washington Square Mall example to illustrate how to align monitoring elements with SMART functional objectives.
Key questions to ask when developing a functional objective centered monitoring approach are as follows:
- What media should be monitored?
- What constituents should be monitored?
- Beyond the COCs, what other parameters should be monitored to establish multiple lines of evidence to evaluate performance?
- How many lines of evidence are needed for an assessment toward a functional objective?
- What metrics should be used?
- Where should monitoring points be located?
- When should monitoring occur?
5.1 Types of Monitoring
Three types of monitoring are typically used at chlorinated-solvent sites: compliance, process, and performance. The parameters monitored in compliance, process, and performance monitoring can vary (e.g., concentration at a monitoring well, the mass discharge leaving the source zone, or the pumping rate from a containment system). Decision makers design the monitoring system to provide useful information about the nature and extent of impacts, how well a remedial approach is operating, and how well a remedial approach is meeting planned expectations (i.e., SMART functional objectives). Each is described below:
- Compliance monitoring is used throughout the IDSS life cycle to document the nature and extent of impacts, as well as the status of exposure pathways. Investigation and characterization of chlorinated-solvent sites is the first step of systematic compliance monitoring. Compliance monitoring may also be included within process and performance monitoring, as discussed below, and therefore is an overall goal of an IDSS monitoring approach and the basis by which attainment of functional and absolute objectives is evaluated. Compliance decision making may require a higher level of certainty and be subject to nontechnical factors that lead to the use of different analytical protocols, monitoring locations, and/or monitoring frequencies than are required for process and performance
- Process monitoring assesses whether a remediation system is meeting or approaching its functional objectives (ITRC 2008b). If not, process monitoring data are used to identify the need for adjustments and modifications to the remedial system(s) to improve performance (i.e., process optimization).
- Performance monitoring is used to assess the effectiveness of the remedial approach in meeting the SMART functional objectives (see Text Box 5-1). Typically, multiple lines of evidence or types of data are collected to measure the effects of remediation on the concentrations or the mass discharge of COCs, the completeness of treatment, and the secondary impacts of remediation on groundwater quality. Effective performance monitoring approach enables decision makers to assess the value of the existing remediation program, required alterations of the existing remedial approach, and evaluation of the soundness (SMARTness) of the functional objectives.
Text Box 5-1. Fort Lewis East Gate Disposal Yard, Strategic Monitoring (see Appendix A)
The Fort Lewis East Gate Disposal Yard remedial action is a prime example case study showing how strategic monitoring resulted in more effective and efficient cleanup of chlorinated solvents. In 1998 an Explanation of Significant Difference was issued to allow further investigation into the nature and extent of the contaminants of concern (COCs) as well as to enhance the selected remedy. This understanding allowed innovative treatment strategies to be considered, such as the Triad approach for characterizing migration of COCs, as well as the use of ERH to remove the NAPL. Having this flexibility in place was instrumental in the practitioners’ ability to make modifications during all phases of remedial action, from initial installation to relocating to the additional areas needing treatment, to ensure remedial process performance.
Monitoring systems evolve to fill in data gaps, refine the CSM, and optimize the number of samples and analyses required to measure compliance, process, and performance. Each is not necessarily a distinct suite of subsurface monitoring methods and locations. Rather, samples can offer data for two or more of the monitoring types. For example, performance monitoring data at distance from a DNAPL source zone may also be used as exposure point compliance monitoring over the longer term or for permit compliance. This factor highlights the value of a complete CSM and an understanding of source-plume dynamics (see Section 2).
The following sections help the users query themselves to determine what, where, and when data should be collected and analyzed to evaluate elements of a remedial approach. The section also contains reference citations for previously developed step-by-step approaches to the development of the elements of a typical monitoring approach.
5.2 Media to Monitor
Functional objectives are evaluated by measuring contaminant or chemical relationships using concentration, for example, µg/L (water), µg/kg (solids), or mass moving through a vertical plane of the subsurface as mass flux (g/d/m2) or mass discharge (g/d) (ITRC 2010b). Evaluation of chemical, physical, or biological processes in the subsurface that affect remedy performance and the distribution of COCs, depends on the media monitored. Media selection is influenced by functional objectives and potential exposure pathways. The sections below discuss media typically monitored at chlorinated-solvent sites.
5.2.1 Dense, Nonaqueous-Phase Liquid
DNAPL is the least commonly monitored media because DNAPL is difficult to locate and collect. DNAPL monitoring is limited due to the means in which DNAPL moves through the subsurface (Section 2). Screening for DNAPL during the site characterization phase can help determine whether the monitoring plan should include further DNAPL monitoring and/or screening. Since detecting DNAPL at a site is often difficult, high concentrations of dissolved- phase constituents (aqueous concentrations >1% of the DNAPLs solubility) are typically used to indicate DNAPL presence (Kueper and Davie 2009).
5.2.2Aquifer Matrix Materials
Aquifer matrix material is sampled to determine the distribution and extent of chlorinated solvent constituents in the source zone. As the groundwater moves through the source zone, a plume of dissolved constituents moves away from the source zone. These dissolved constituents sorb to aquifer matrix material and diffuse away from zones with relatively higher concentrations into zones with lower concentrations. Sorption occurs within these less-transmissive zones where little to no groundwater flow occurs, effectively creating zones that later act as supplemental sources, which can sustain a groundwater plume after the more-transmissive zones are remediated. As a result, monitoring programs may include sampling the aquifer matrix material in various geologic strata.
Limitations to aquifer matrix monitoring include the following:
- high spatial and temporal variability in sampling results (Statistical methods and sampling procedures have been developed to address these issues, e.g., USEPA 2009b.)
- representativeness of samples due to small sample mass
- aquifer heterogeneity
These limitations can cause estimates of the mass of chlorinated solvents in the subsurface to be imprecise and unreliable. Nonetheless, the information obtained from samples of the aquifer matrix can be used to do the following:
- establish baseline aquifer matrix concentrations
- improve the understanding of the distribution of chlorinated solvents at a site
- monitor progress of contamination and remediation efforts
- modify the operational design of a remedy
- evaluate the completeness of a remedial action
5.2.3 Soil Gas
Soil gas sampling is useful at chlorinated-solvent sites to assess the potential for human exposure from vapor intrusion into indoor air and as a qualitative screening tool to rapidly detect DNAPL source areas in unsaturated soil (ITRC 2007c). Soil gas sampling data can delineate the areal extent of soil gas migration in and from the unsaturated zone. Soil gas sampling has also been used to evaluate conditions near the water table and the potential for groundwater to contribute chlorinated-solvent compounds to soil gas. Samples collected in a vertical profile can help delineate lateral or vertical migration of soil gas due to variations in the subsurface stratigraphy and vapor characteristics. To evaluate the potential for soil gas to cause a vapor intrusion (indoor air) exposure, sampling locations should be spaced to adequately represent soil gas concentrations near any structures, taking into consideration the location of contamination relative to the structures and atmospheric effects (ITRC 2007c). The actual number of soil gas sampling points necessary for a given site depends on site-specific conditions and is likely to change during the life cycle of a project. Location and installation of soil gas monitoring should consider the following:
- public concern over exposure through this pathway
- temporal variations due to the following:
- seasonal and short-term influences (e.g., barometric pressure, precipitation, or wind)
- remedial program impacts
- increased fundamental understanding of transport processes (e.g., retardation and partitioning)
- sample collection representativeness and uncertainty
- new sampling approaches
5.2.4 Groundwater
Groundwater monitoring programs collect data that intend to represent the concentration of contaminants, contaminant degradation products, water chemistry (pH, Eh, temperature), and other aqueous chemicals that may influence the behavior of chlorinated solvents dissolved in groundwater. Groundwater samplers are designed to obtain a representative water sample (e.g., low-flow sampler, Snap Sampler™, HydraSleeve™) or groundwater contaminant concentration value (e.g., GORE Module™; regenerated-cellulose dialysis membrane sampler; rigid, porous polyethylene sampler; polyethylene diffusion bag sampler) from groundwater monitoring wells (ITRC 2004c, 2007b). However, groundwater sampling methodology can influence sample results, and care should be exercised when mixing results from various sample collection methods.
The design of a groundwater monitoring program should be based on the needs defined by the functional objectives, the CSM, and refinements to the CSM resulting from analysis of monitoring data over time. A groundwater monitoring program should achieve the following:
- monitor temporal or spatial changes in contaminant concentrations
- monitor changes in subsurface aquifer conditions such as geochemistry
- monitor progress toward regulatory compliance
- monitor contaminant concentration or mass in potential exposure routes
- assess mass balance (e.g., determine the baseline mass in the different compartments, or the media they represent, using groundwater concentration and soil mass values, mass reduction due to remedial actions, and mass discharge to groundwater (in conjunction with aquifer hydraulic properties)
- assess and demonstrate remedial efficiency (process monitoring)
- assess remedial effectiveness (performance monitoring)
- confirm completion of treatment and site closure
Groundwater monitoring programs should be periodically reviewed and optimized to ensure that the data being collected continue to be useful and relevant in achievement of site-specific functional objectives. As remediation progresses and subsurface conditions change, the groundwater monitoring program should evolve.
5.2.5 Surface Water
Depending on the site, surface water may be part of the monitoring strategy. The discussion in this guidance is not focused on sites where a groundwater plume is discharging to surface water. While surface-water analytes may be similar to groundwater analytes—concentration of contaminants, contaminant degradation products, and water chemistry (pH, Eh, temperature)— surface water metrics should also include parameters such as near-shore and off-shore hydraulic head, sediment characteristics, and direct seepage measurements. Guidance on surface-water monitoring discussing monitoring techniques such as Trident Probes and UltraSeep, as well as standard water-column collection, can be found in ITRC 2011b.
Surface water monitoring program should consider the following:
- groundwater-to-surface water discharge locations
- monitoring depth
- how the data will be used
5.3 Aligning Data to SMART Functional Objectives
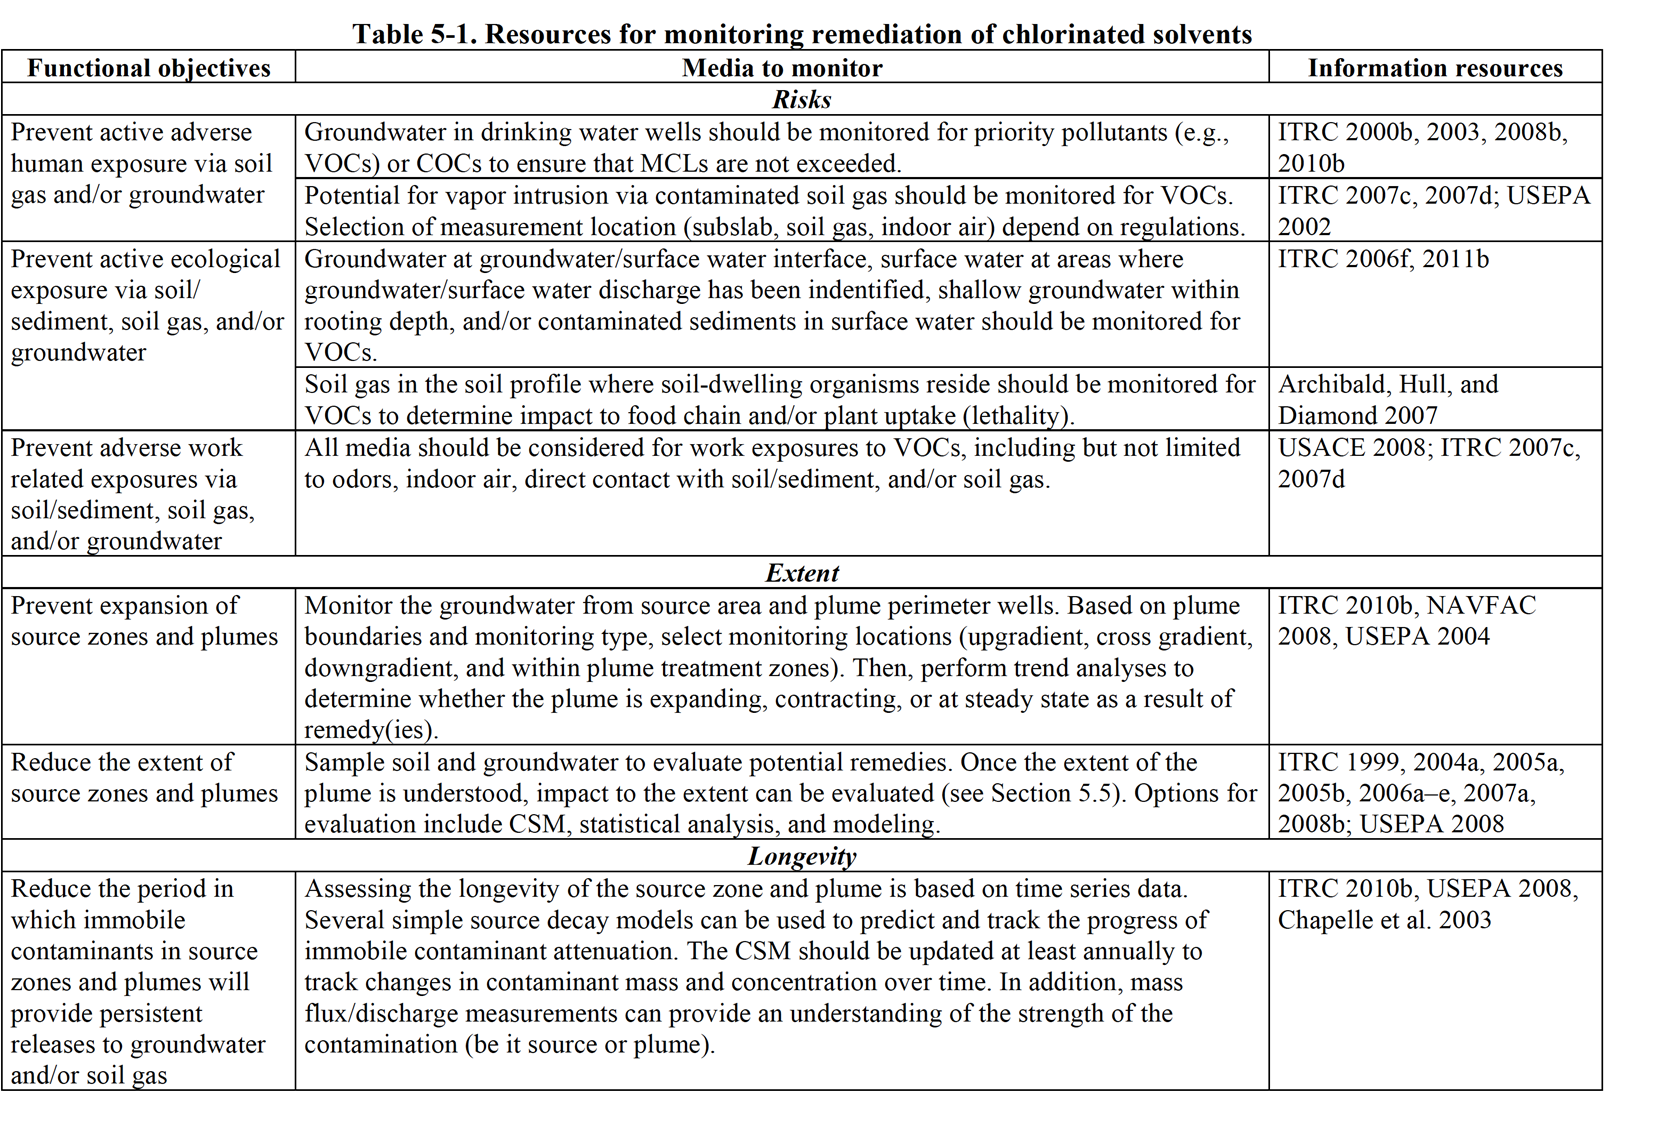
Site decision makers establish a two- or three-dimensional monitoring system that evaluates the progress of the remedial approach using the metrics defined to measure performance within the time frame outlined in the SMART functional objective (see Table 3-3 for examples of metrics and time frames). Table 5-1 illustrates potential monitoring approaches for examples of functional objectives. Citations are provided to guide the user to more detailed information for specific, contaminant phases, media, and target contaminants.
5.4 Metrics
To assess overarching functional objectives such as exposure, extent, fate, and transport of chlorinated solvent in a source zone or plume, as well as progress of remedial actions, SMART attributes need to be assigned to the functional objectives. Through that process, a specific, measurable quantity or metric must be selected for each media to be monitored. Typically, metrics are selected in either concentration or mass units. However, mass flux/discharge is emerging as a new and useful metric at chlorinated-solvent sites. A monitoring strategy can include a combination of concentration, mass flux, and mass discharge metrics.
5.4.1 Concentration
Contaminant concentration is the traditional means for assessing soil, groundwater, and soil gas and is typically the metric for assessing the site’s remedial progress and compliance. Compliance values are typically a concentration-based metric implying protectiveness. A groundwater analytical value represents only an average contaminant concentration in water over the sample interval controlling the flow of water into or past the sampling device during the time of the sample collection. This is an important consideration given the emphasis concentration data have on the decision-making process. A rigorous assessment of sampling methodologies, the methods’ influence on the sample results, and their relationship to the metric measuring conformance with the functional objectives should be carefully considered in the monitoring approach. Bias in sampling methods (e.g., the effect of pumping rate on the groundwater sample, seasonable influence, etc.) should be recognized and given due consideration.
5.4.2 Mass
Estimating the mass of a contaminant, either removed, reduced, destroyed, or remaining, from a chlorinated-solvent plume (source zone or downgradient plume) can be an effective way to evaluate remedial performance and assess potential exposure. Estimating mass destroyed can be derived from calculating the total mass balance, including the degradation products, or measuring the difference between the estimated initial and final aqueous mass. ITRC (2010b) points out:
Many regulatory discussions about sites with groundwater contamination are driven by point-in-time measurements of contaminant concentration—snapshots of contaminant concentrations that may appear to be relatively stable or to show notable changes over time. However, concentration data alone cannot answer all questions critical to contaminant plume assessment or management.
Use of DNAPL mass, either removed or remaining, in predicting remedial success may be difficult due to uncertainties in estimates.
5.4.2 Mass Flux/Discharge
Recent research efforts and remediation activities have begun to avoid total reliance on contaminant concentration in soil and water for site characterization and remedial performance assessment. Contaminant mass flux and mass discharge, in conjunction with contaminant concentrations, are used to better understand contaminant behavior and encourage more precise decisions on remedial activities (ITRC 2010b, SERDP/ESTCP 2010). Mass flux and mass discharge estimates can help remediation project managers answer several key questions:
- Is the contaminant plume stable, expanding, or contracting?
- How will a proposed remedial action affect the future distribution, transport, and/or fate of the contaminants?
- What will be the risks and exposures at various points throughout the foreseeable future?
- How much source removal will be needed before transitioning to other technologies such as ISB or allowing MNA to complete the site remediation?
These estimates do have limitations and inherent uncertainty (ITRC 2010b, Sections 2.5 and 4.5). In fact, the uncertainty can be significant and should be quantified and considered relative to the typically more uncertain “concentration only” approaches. The collection of mass flux and mass discharge data can increase cost, since reliable mass flux or mass discharge estimates often can require better local characterization of the hydraulic conductivity and groundwater flow than the information typically available for a site. The degree of accuracy required for mass flux or discharge estimates should be determined based on objectives. In some cases an initial rough approximation may be sufficient, while more accurate measurements are necessary later (ITRC 2010b). Even with the uncertainty found in these measurements, mass flux and mass discharge data may improve evaluation of remedial activities because they do the following:
- combine contaminant concentration and groundwater movement data
- can be conceptually linked to the dose-response curve used in exposure evaluation
- provide a new perspective on potential impacts to receptors
- quantify changes in contaminant mobility and movement over time
- enhance evaluation and optimization of remedial technology and system operation
- help in determining whether or when remedial goals will be approached or met
- help in assessment of effectiveness or benefit of additional treatments over distance or time
- provide additional insight and information on remedy response(s) within the aqueous phase (e.g., stagnant versus mobile aquifer)
5.5 Data Evaluation
Data evaluation and interpretation are key components to evaluate whether functional objectives are being achieved at a sufficient rate (i.e., Is performance of a remedial approach indicative of a successful outcome?). A variety of tools and methods can effectively synthesize data to establish whether progress towards objectives is being made, generally including updating the CSM, statistical analysis, and modeling, which can include predictive and validation modeling. The follow sections provide brief overview of these tools and methods, along with an example to illustrate how to evaluate progress towards achieving objectives as the platform for decision making.
5.5.1 Maintaining the Conceptual Site Model
Continued reassessment of the CSM is an essential element of an IDSS. Each type of monitoring used at chlorinated-solvent sites (compliance, process, and performance) is essential for ongoing verification and development of the CSM (see Chapter 2). Evaluation of data sets, through the use of multiple lines of evidence, supports strategic decision making, including remedy evaluation as described later in Chapter 6. The CSM should be updated each time functional objectives are assessed and as a monitoring program is implemented.
Advances in data processing have improved our ability to maintain and continuously update a site’s CSM using data visualization. Data visualization has the following potential benefits:
- increased stakeholder engagement
- a three-dimensional image conveys more information than many two-dimensional images
- improved CSM
- improved understanding of the vertical distribution of contaminants
- assessment of simplified two-dimensional methods for consistency
- additional statistical analysis methods
- improved remedy design, cost effectiveness, and performance
- improved understanding of spatial position of residual impacts
- reduced quantities of treatment materials as a result of better contaminant targeting
Database and processing improvements have reduced the cost of data visualization in the last several years. Examples of visualization software packages and tools include the following:
- ArcGIS 3D Analyst
- EarthVision
- Groundwater Modeling System
- MVS (a Commercial Tech product)
- Google Sketch Up and Google Earth
- AutoCAD
5.5.2 Statistical Analysis
Evaluating statistical trends is one of the most useful methods for assessing monitoring data sets to determine whether progress is being made towards a quantitative objective (e.g., rate of reduction in groundwater contaminant concentration in compliance well). The latest version of the Statistical Analysis of Groundwater Monitoring Data at RCRA Facilities: Unified Guidance (EPA 2009b) is a compendium of current statistical methods in use at many chlorinated-solvent sites. Groundwater statistical methods are a continuously developing discipline, and ITRC formed a team in 2011 to develop additional guidance.
One of the most common statistical methods is trend analysis of the rate of change in a metric. Trends are very important to establish the rate at which a functional objective is being achieved and can be used predicatively to estimate the time required to achieve the objective. However, any predictions must be explained, and those explanations must be validated by continued data evaluation. There are a number of statistical and empirical methods to calculate and define trends. For example, Aziz et al. (2003) and the Monitoring and Remediation Optimization System (MAROS) present a method where Mann-Kendall analysis and/or linear regression is used to categorize time series data as having either an increasing, probably increasing, stable, probably decreasing, or decreasing trend or statistically “no trend” at all. Other tools such as SourceDK (see Section 5.5.3), GTS, and Summit Monitoring can also be used to determine trends.
Text Box 5-2. Air Force Plant 44, Stable Trend Resulting in a Change in the Remedy (see Appendix A)
TCE values immediately below the former disposal areas indicated that mass discharge equaled mass removed using the P&T system. This finding resulted in the decision to remove the source areas while still operating the P&T system.
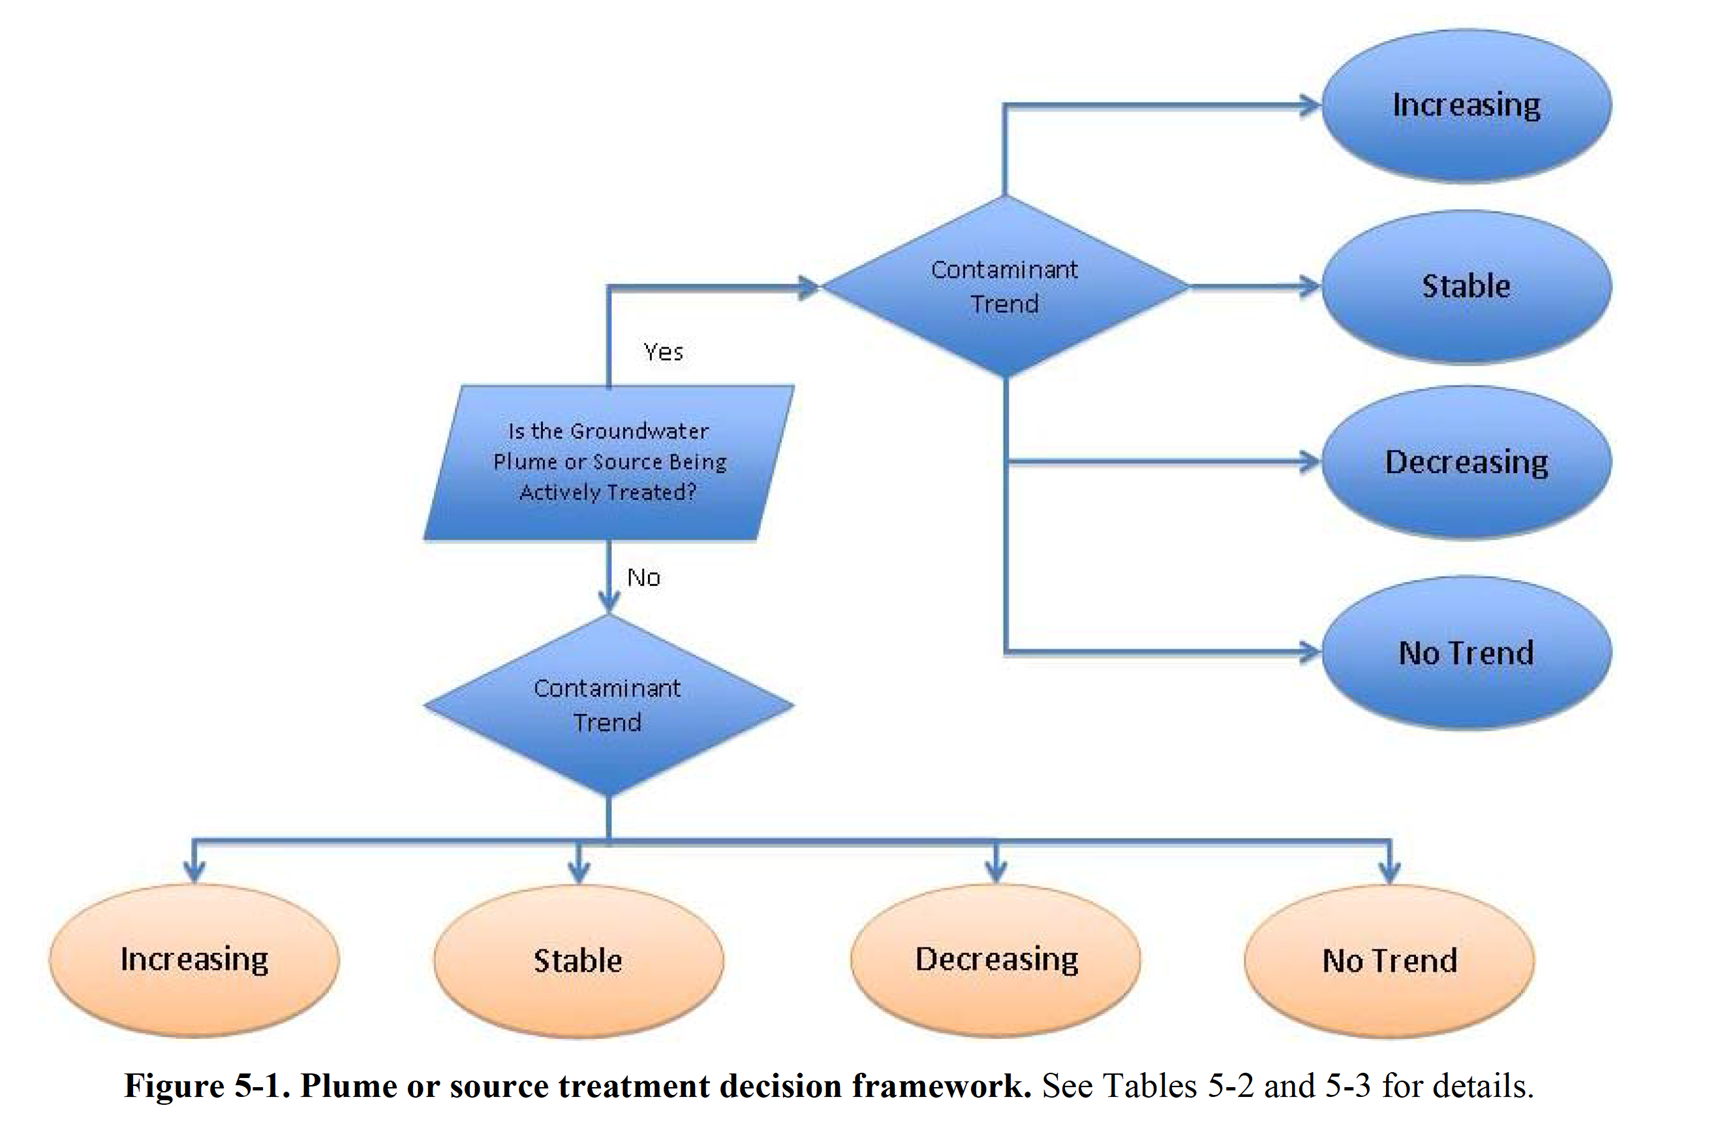
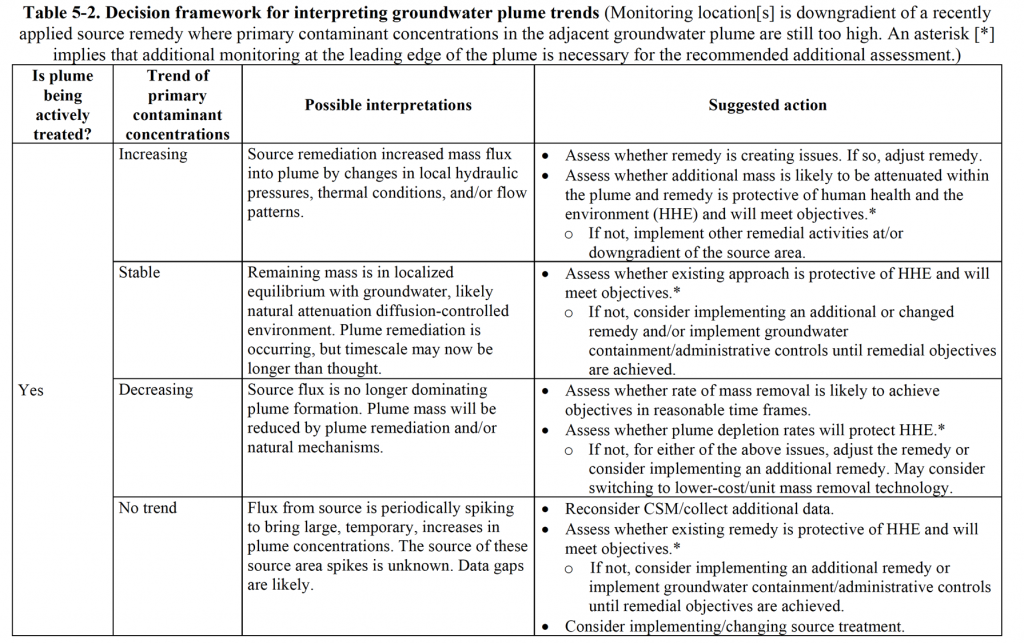
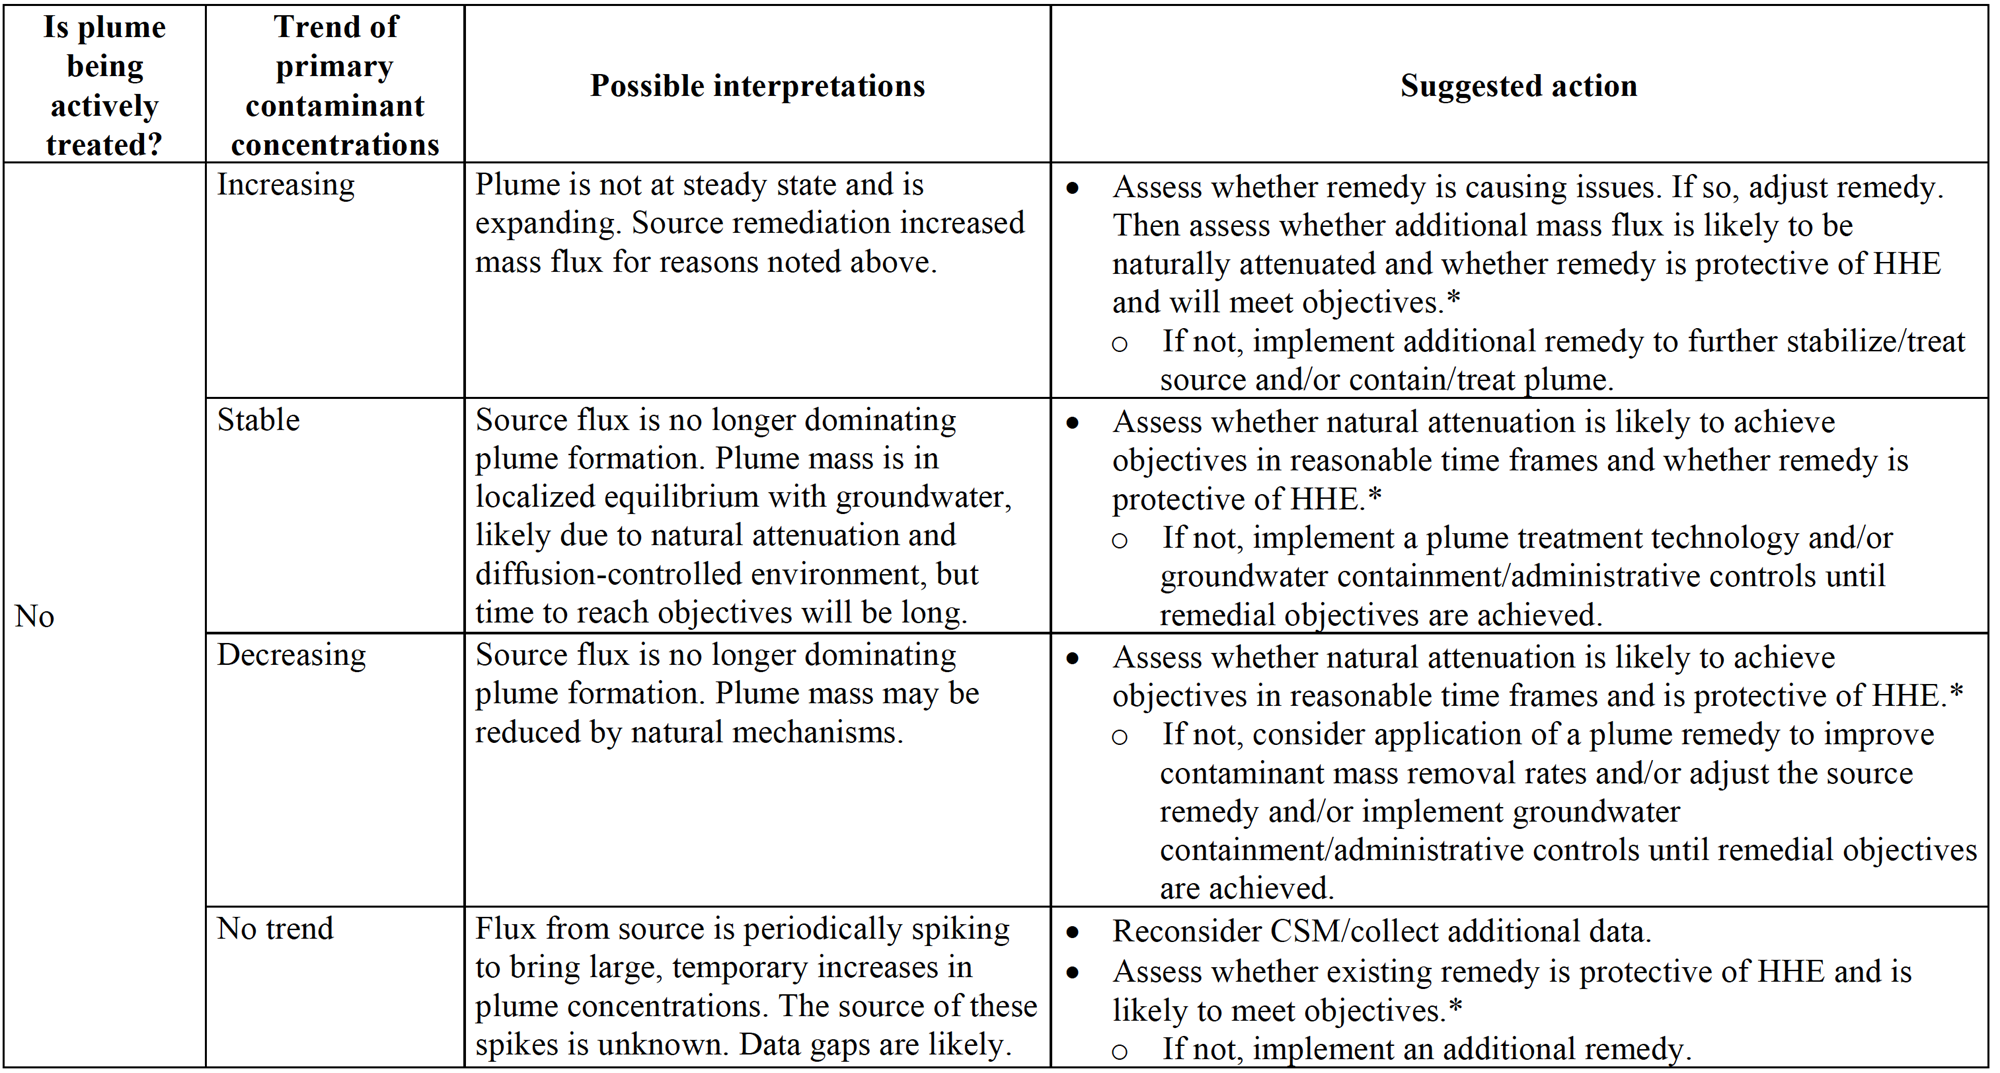
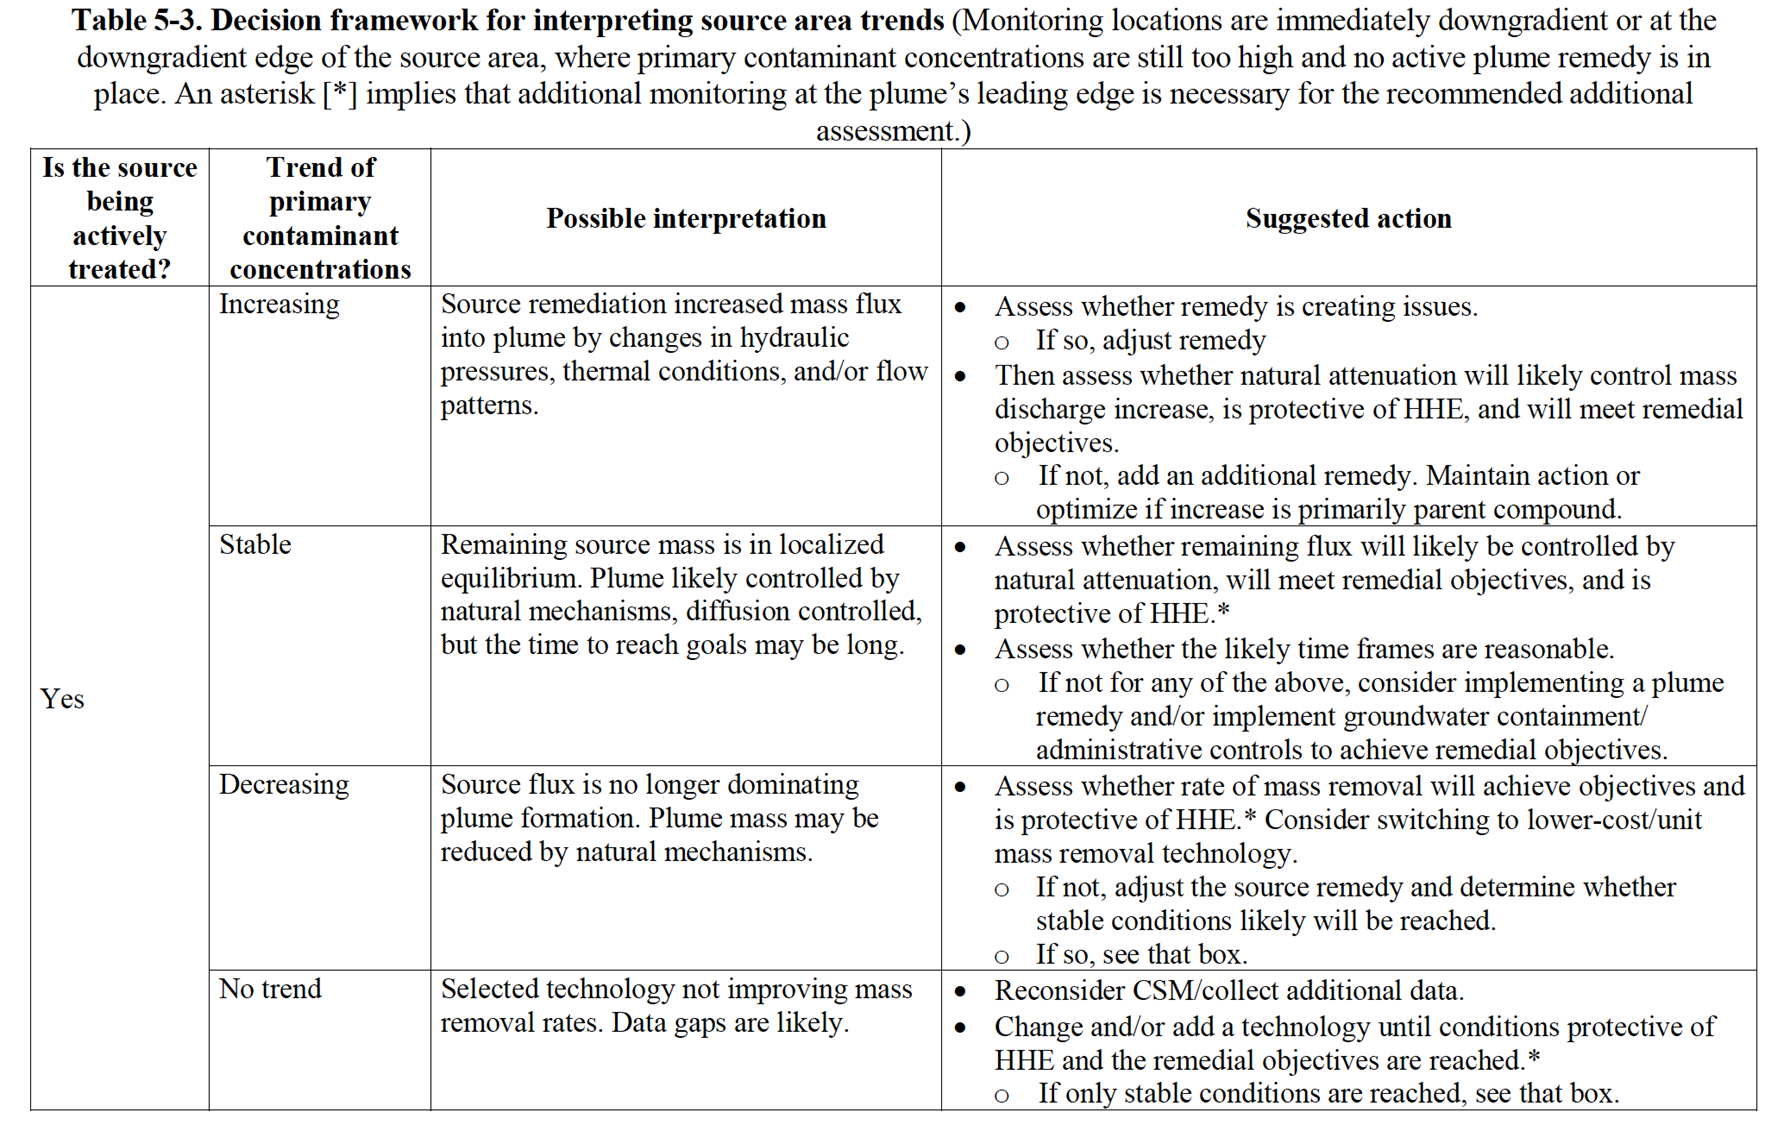
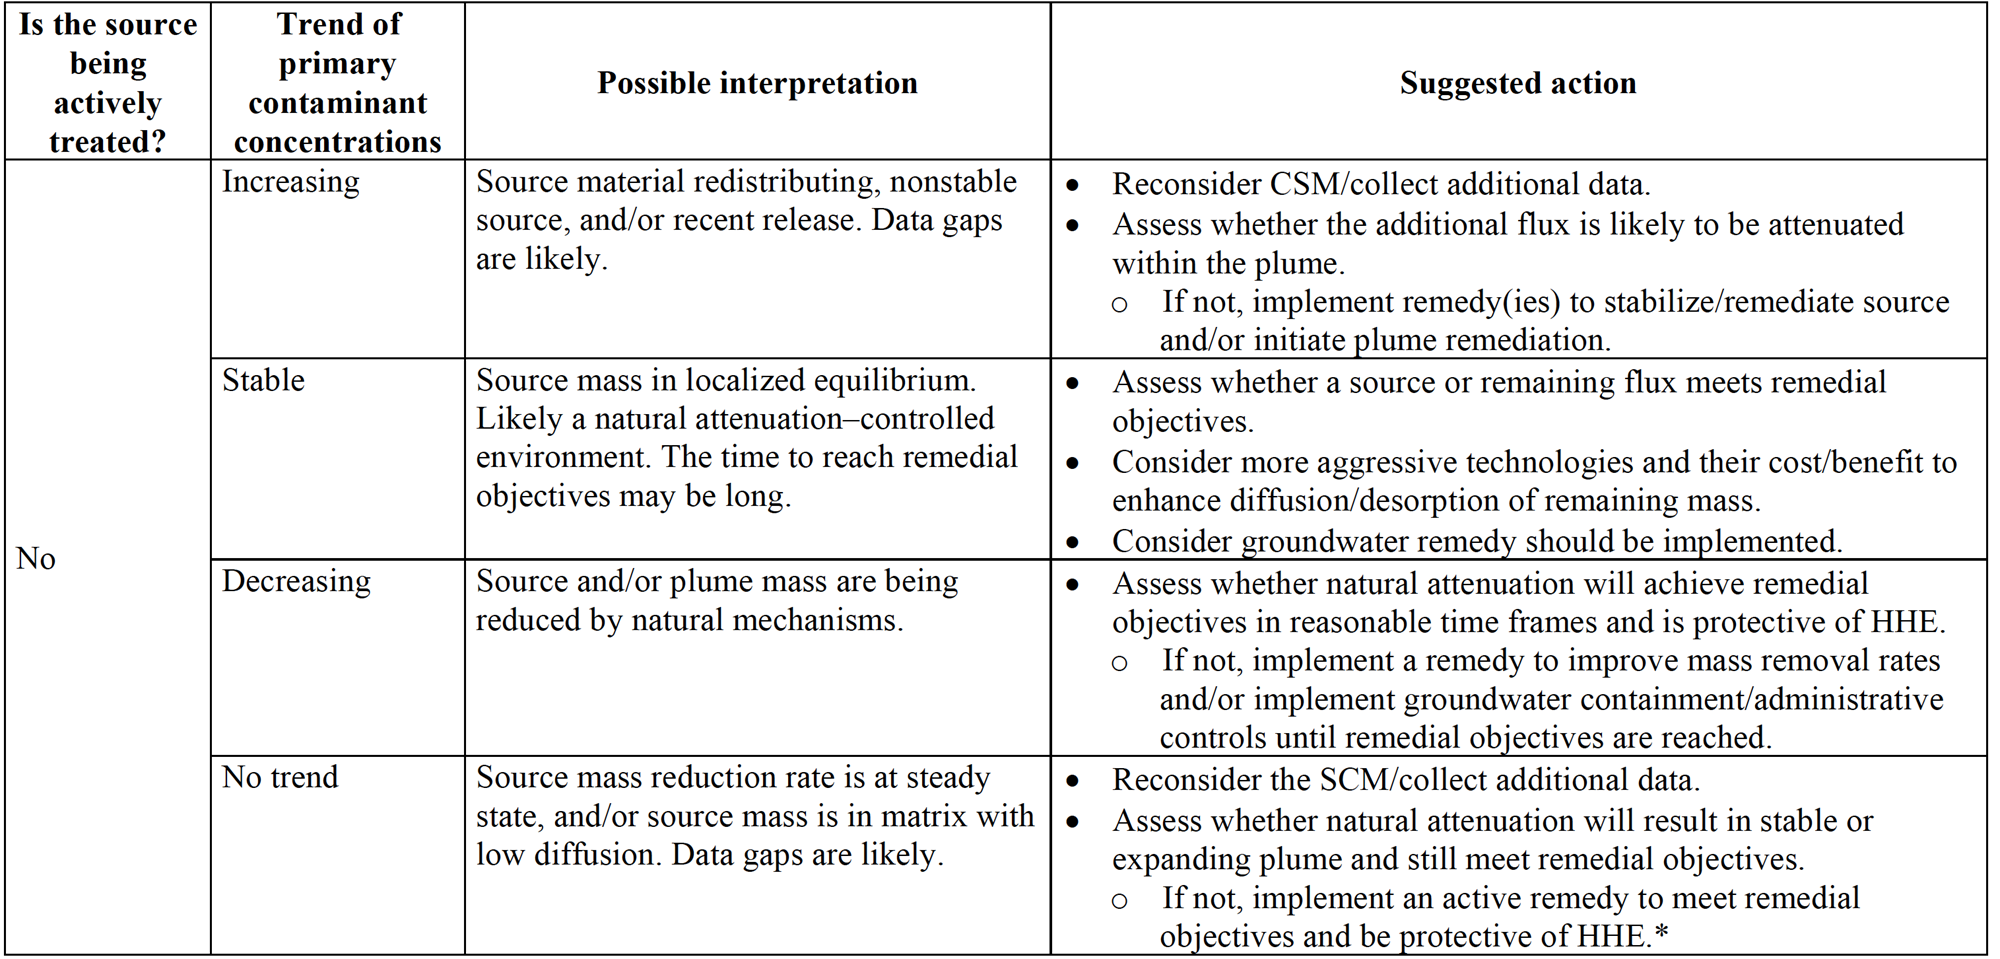
Figure 5-1 illustrates a decision framework from which to begin the data trend interpretation process. The initial step is answering the question of whether a remedial action is being taken. From there, one is brought to either a set of blue contaminant trends indicating the plume is being remediated (increasing, stable [see Text Box 5-2], decreasing, or no trend) or orange trends indicating that the plume is not being remediated. After establishing the behavior of the monitoring results from Figure 5-1, refer then to
Tables 5-2 (plumes or aqueous phase) or Table 5-3 (source zone). Each table offers possible interpretations and types of decision needed based on the trend indicated in Figure 5-1. In addition to the decision framework tables, there are several key tools that can be used to evaluate trends, such as the MAROS software. MAROS is a database application developed to assist users with groundwater data trend analysis and long-term monitoring optimization at contaminated groundwater sites.
5.5.3 Models as Tools
Groundwater models have been used extensively in the past for assessing both compliance and performance monitoring. Contaminant fate and transport models (also called “solute transport models”), typically based on the advection-dispersion (A-D) equation, are commonly used to evaluate plume stability in terms of potential expansion and/or contraction. More specifically, model simulations are used to estimate downgradient chemical concentrations and mass discharge before and after a remediation program. Source zone models simulate source processes such as changes in source strength due to natural attenuation and remediation.
Table 5-4 outlines some of the groundwater models commonly employed by the environmental industry today. It should be noted this list is for information purposes and is not intended to capture all models. Table 5-4 provides information on whether each model should be used as a source or A-D fate and transport model based on the A-D equation (or both), its solution method (such as whether it relies on an analytical or numerical approach), a summary of the model’s capabilities, and where to get the model (all models are public domain unless labeled “commercial software package”).
For example, BIOCHLOR is an analytical groundwater flow and contaminant transport model based on the A-D equation developed as a screening tool to simulate remediation through natural attenuation. BIOCHLOR simulates biodegradation of dissolved chlorinated solvents using sequential first-order decay for reductive dechlorination. It has a simple source zone model to account for source attenuation over time.
REMChlor is a new analytical model that contains many of the same processes as BIOCHLOR but also includes a source zone model which allows users to simulate source remediation (e.g., inputting a desired amount of mass removal in the source zone) and a plume module that allows evaluation of active plume remediation (e.g., electron donor addition) over nine different time/ space combinations. The plume module is based on the A-D equation. BIOPLUME, BIOCHLOR, and REMChlor are all distributed and supported by USEPA.
Models such as RT3D and SEAM3D use a finite-difference numerical solution of the transport equation to solve the A-D equation. As an input to the numerical transport model, the groundwater flow equation must be solved using MODFLOW, which is also a finite-difference model. As the table shows, numerical models can simulate the same natural attenuation mechanisms as the analytical models; however, the user defines all aspects of the site’s conditions and the attenuation parameters. RT3D and SEAM3D do not have formal source zone simulation models but rely on user input to account for change in source strength over time.
Some of the tools provide calculator-type capabilities to answer specific questions. BioBalance has two modules related to electron donor/electron acceptor supply and demand. The SourceDK tool has an empirical data extrapolation tool to evaluate remediation time frames and the uncertainty in these estimates. Both SourceDK and NAS estimate the time to remediation and the uncertainties associated with those calculations. In addition, both NAS and BioBalance provide estimates for plume stabilization length and time frames.
Table 5-4. Summary of models used in the environmental industry
| Model | Solution method | Intended application | Capabilities and access |
| BioBalance Tool Kit | Mass balance approach | Source and/ or A-D fate and transport | Evaluate natural attenuation capacity at site. Includes four modules (source, competition, electron donor, and plume) and combines the modules for the final mass balance. www.gsi-net.com |
| BIOCHLOR | Analytical solution | Source and/ or A-D fate and transport | Fate and transport of chlorinated solvents (first- order decay). https://www.epa.gov/water-research/biochlor-natural-attenuation-decision-support-system |
| NAS | Combination of analytical and numerical solutions | Source and/ or A-D fate and transport | Includes three main interactive modules to provide estimates for distance of stabilization, time of stabilization, and time of remediation. |
| REMChlor-MD | Analytical solution | Source and/ or A-D fate and transport | Fate and transport of chlorinated solvents (first- order decay). Allows user to remediate source and/or plume at different times and different locations. Considers matrix diffusion effects in both source and plume.https://www.epa.gov/water-research/biochlor-natural-attenuation-decision-support-system |
| BIOPLUME | Numerical solution (up to two dimensional) | Primarily A-D fate and transport | Fate and transport via inputting site-specific hydraulic and attenuation parameters. https://www.epa.gov/water-research/biochlor-natural-attenuation-decision-support-system |
| MT3D | Numerical solution (up to three dimensional) | Primarily A-D fate and transport | Fate and transport via inputting site-specific hydraulic and attenuation parameters. (Typically used in commercial software package) |
| RT3D | Numerical solution (three dimensional) | Primarily A-D fate and transport | Fate and transport via inputting site-specific hydraulic and attenuation parameters. (Typically used in commercial software package) |
| SEAM3D | Numerical solution (three dimensional) | Primarily A-D fate and transport | Fate and transport via inputting site-specific hydraulic and attenuation parameters. |
| SourceDK | Analytical solution | Primarily source | Remedial time-frame decision-support tool that can evaluate data using three tiers. Tier 1 relies on empirical data, Tier 2 uses a box model, and Tier 3 uses a process model. www.gsi-net.com |
REMChlor-MD is a new version of the REMChlor analytical model that contains many of the same processes as BIOCHLOR, but also includes: 1) a source zone model which allows users to simulate source remediation (e.g. inputting a desired amount of mass removal in the source zone) and 2) a plume module that allows evaluation of active plume remediation (e.g. electron donor addition) over nine different time/space combinations. The plume module is based on the advection-dispersion equation but includes a new feature where users enter data regarding geologic heterogeneity at their site and the model simulates the effects of matrix diffusion on plume fate and transport and plume remediation. BIOPLUME, BIOCHLOR and REMCHlor are all distributed and supported by the USEPA.
Models such as RT3D and SEAM3D use a finite-difference numerical solution of the transport equation to solve the advection-dispersion equation. As an input to the numerical transport model, the groundwater flow equation must be solved using MODFLOW which is also a finite-difference model. As the table shows, numerical models can simulate the same natural attenuation mechanisms as the analytical models however the user defines all aspects of the site’s conditions and the attenuation parameters. RT3D and SEAM3D do not have formal source zone simulation models, but rely on user input to account for change in source strength over time. One important caution is that finite difference models have difficulty simulating matrix diffusion unless very fine layering is used (e.g., layers on the order of 10 centimeters thick). With commonly used layering in these models (1 or more meters thick) erroneous results can occur (Chapman et al., 2012; Farhat et al., 2020).
Recently, there has been a call by some researchers (Payne, Quinnan, and Potter 2008; Konikow 2011) to reevaluate some of the basic assumptions and applicability of the A-D equation used in several of the models in Table 5.4, citing inaccurate underlying assumptions and inaccurate representation of actual hydrogeologic conditions in the subsurface. The IDSS Team had extensive discussion regarding two different viewpoints about this emerging theoretical issue:
- Traditional view: Currently the debate is on-going (Hadley and Newell, 2014). Other researchers have concluded while the A-D model may have some theoretical inaccuracies, the way it is applied in typical groundwater model projects does provide useful, reliable information to site managers. In a typical groundwater modeling project, dispersion has these characteristics: (a) it is used as a adjustment factor to help represent large-scale heterogeneity that has shaped the size and shape of the observed groundwater plume, and (b) it is often a “second-order process,” one that is much less important than advection and degradation for many modeling projects. In addition, while groundwater models without a matrix diffusion term do not account for this important process, skilled modelers now know that the A-D model may be too optimistic when simulating long-term, lower-concentration cleanup scenarios. This knowledge can be incorporated into site remediation strategies, particularly if the flexible site management approach shown in Figure 1-2 is employed.
- Alternative view: There are two sources of contaminant spreading in the A-D equation: spreading of molecules within the water mass (aqueous-phase diffusion) and spreading of the moving water mass within the porous medium (hydrodynamic dispersion). The spreading of molecules within the water mass (diffusion) is well-founded, and measured diffusivities are available for most compounds of interest. In retrospect, the hydrodynamic dispersivity element of the A-D equation requires turbulent mixing to impact spreading at the plume scale, but the pore dimensions and attainable velocities in aquifers assure us that only laminar viscous fluid flow is possible. In fact, field measurements repeatedly have shown that contaminant spreading in aquifers is very limited in the transverse (vertical and horizontal, perpendicular to the flow path) and longitudinal (along the flow path)
The alternative view is that the limited spreading that does occur primarily depends on variations in aquifer permeability along the flow path and on pore-scale diffusion processes (e.g., Gilham et al. 1984), as compared to the assumption that hydrodynamic dispersivity (random-walk dispersion) more strongly influences transport in aquifers. Therefore, any groundwater model that incorporates significant hydrodynamic dispersivity overstates the potential for plume spreading and the resulting dilution. Models that rely on the A-D equation should be used with great caution or not used at all. (Text Box 5-3 provides a description of this viewpoint.)
Text Box 5-3. Viewpoint of One Groundwater Scientist Who Questions the Applicability of Advection-Dispersion Models (“Alternative View”)
The ability of quantitative models to predict plume development and response to remediation has been severely tested in DNAPL sites and at research sites where solute transport has been studied at high resolution (Eggleston and Rojstaczer 2000). In particular, mathematical and conceptual limitations of the A-D equation, which is the foundation of many models, are now being recognized (e.g., Konikow 2011; Eggleston and Rojstaczer 2000; Payne, Quinnan, and Potter 2008). One way to illustrate the modeling difficulties is the predictions generated for a pulse of solute entering an aquifer as in a tracer study.
The upper portion of Figure 5-2 shows two concentration-versus-time tracer breakthrough curves. On the right is a Gaussian (bell-shaped) curve with its peak arrival time determined by the average groundwater velocity. This is the breakthrough curve that is predicted by typical applications of the A-D equation (a.k.a. ADE) approach. To the left is a log-normal peak that represents diffusion-based tracer behavior, and there are two key distinctions relative to the A-S prediction: (a) the peak arrival is much earlier than predicted by the average groundwater velocity due to the fact that groundwater flow is focused in the most permeable portion of the formation, and (b) the peak shows long tailing due to at least two factors: the observation well may be compositing multiple conductive zones (as described earlier in Figure 2-7) and diffusive migration of solute into and back out of lower-permeability strata adjacent to the high-flow groundwater pathways.
The lower portion of Figure 5-2 shows predictions related to the impact of source depletion or elimination on a dissolved-phase plume. The gray-line curve to the right side of the figure shows the predicted concentration reduction predicted with an A-D–based calculation. The cleanup front is a Gaussian curve, and its arrival time is estimated by the average groundwater velocity. Heterogeneities in natural aquifers lead to a different breakthrough of the cleanup front, depicted on the left curve of the lower panel in Figure 5-2. In this case, the initial indication of clean water transport occurs much earlier than the average groundwater velocity would indicate, in the same way that tracer arrival begins much earlier than average velocities indicate. However, the tailing effect due to diffusivity and multivelocity effects shows as a tailing of the cleanup curve. The shape of the tailing process is determined in part by the nature of aquifer heterogeneities and the duration of contaminant exposure to the aquifer matrix.
When modelers using the A-D equation encounter early-arriving log-normal concentration patterns, they call it anomalous behavior (Konikow 2011) even though it is actually typical site behavior. This point gets to the heart of the difficulty that mathematical models encounter in real aquifer systems: actual site behaviors are “anomalous” in the Gaussian (A-D–based) model system. Konikow (2011) provided an analysis of the mathematical limitations of A-D–based models, and among the points he raised is the fact that the error-to-signal ratio becomes large when dissolved-phase plume concentrations fall to <1% of source zone concentrations. That means for a DNAPL-sourced plume, the models begin to generate unreliable predictions of leading-edge contaminant concentrations of 100s to 1000s of µg/L, which means the predictions are unreliable over a large portion of the dissolved-phase footprint.
Site characterization practices have evolved dramatically in the past 5 years, and there is a rapidly increasing base of high-resolution source and plume mappings, as discussed in 2010b. The higher- resolution mappings show that aquifers are heterogeneous and anisotropic, as a rule, and that the scale of heterogeneities is sufficiently small in many cases to render aqueous-phase diffusion a relevant process. Consequently, there is a growing number of groundwater scientists who recommend that modeling practices be adjusted to represent contaminant transport with much finer-scale discretization(allowing diffusivity to be correctly represented), use of de minimus hydrodynamic dispersivities (representing values obtained in numerous field research studies), and incorporation of realistic anisotropy and heterogeneities (populate the full nine-element permeability tensor to reflect actual site structure in ModFlow, for example). All would contribute to more realistic and reliable modeling.
Figure 5-2. Comparison of tracer breakthrough (upper graph) and cleanup curves from advection-dispersion based (gray lines) and advection-diffusion based (black lines) solute transport.
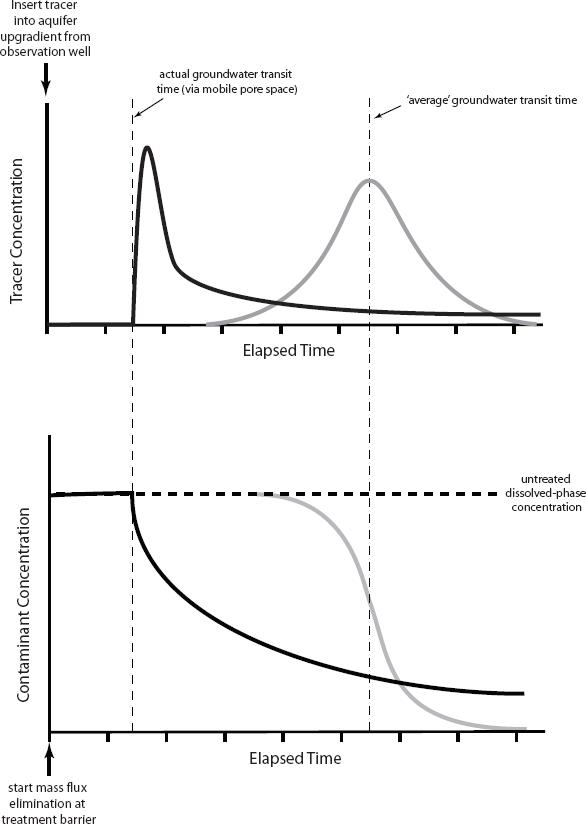
The upper graph shows typical field tracer breakthrough in the solid black line. It is log normal in shape, with the tracer peak arriving at a time earlier than would be expected based on average groundwater velocity calculations. The bell-shaped (Gaussian) curve (gray line on the right side of the upper graph) depicts the tracer breakthrough behavior predicted by an A-D model calculation. Notice that the peak arrival time corresponds to the average groundwater velocity. The lower graph contrasts expected cleanup concentration profiles (concentration downgradient from a DNAPL source zone that has been completely eliminated) for the typical field site and an A-D model. The model (gray line)
projects a clean-water front arriving at a time corresponding to the average groundwater velocity, while a typical heterogeneous site (black line) is expected to show initial concentration reductions much earlier due to flow through the highest-permeability strata. The typical site cleanup curve is expected to show contaminant concentrations lingering much longer (tailing) due to diffusive contaminant mass exchange between zones of high and low permeability.
Source: Redrawn from Payne, Quinnan, and Potter 2008.
While the IDSS Team had members representing both views, the overall team opinion was that the models in Table 5-4 should be a part of the IDSS guidance document and, when used correctly, can provide useful information to site managers. The spirited debate between these two viewpoints continues, while increasing our overall understanding of effective integrated DNAPL site strategy developments.
5.6 Monitoring Optimization
Monitoring programs should be routinely reviewed and optimized (ITRC 2004a, USEPA 2005a) to ensure that the data being collected continue to be useful and relevant in gauging achievement of site-specific functional objectives. As remediation progresses and geochemical conditions change, the monitoring program should be adjusted to collect the information most appropriate to evaluate the performance of the remedy, progress of the remediation, and character of the geochemistry.
Typical modifications to an established monitoring program consider the elements bulleted below within the context of reducing costs while still collecting the appropriate data to assess the remediation progress and geochemical conditions. To facilitate the optimization process, decision criteria for reducing frequency and/or removing locations and constituents should be explicitly stated in the monitoring approach prior to the onset of monitoring. This step helps establish expectations for all concerned parties.
- Monitoring network—Where to collect data depends on the sampling types (performance, compliance, and process) and their functional objectives. Process data should be collected as part of a dynamic O&M plan, which allows for sampling frequency, duration, and constituent alteration based on the treatment system’s performance. A performance monitoring network at a chlorinated-solvent site typically changes over the life cycle of a treatment system and when transitioning from one remedy to another. Compliance monitoring networks should change as plume extent changes. Evaluation of the monitoring network is recommended on an annual basis. If the information gained at a monitoring point does not contribute to the functional objectives for that sampling type, then it may be appropriate to discontinue use of that monitoring point (NAVFAC 2010a).
- Frequency and duration of sample collection—Monitoring frequency and duration can depend on a variety of items such as seasonal variability, data trends, transient site conditions, and monitoring point type. Initially, four rounds of quarterly sampling are typically collected at monitoring locations to address items such as seasonal variability. Process monitoring may require more frequent monitoring to assess treatment system performance. Once a minimum of four data points is collected, trend analysis can be performed. Monitoring locations and constituents should be assessed against decision criteria and functional objectives to determine whether the duration or frequency of data collection should be changed. For example, decision criteria can define which monitoring frequency can decrease once stable or decreasing data trends are observed at the
- Contaminant-constituent monitoring—Analyte selection may change over time as the geochemistry of the site changes, as the remedy moves from active to passive (e.g., ISCO to MNA for metals mobilization), and as contaminants are no longer COCs. These changes in the life cycle of the project can provide significant costs savings if the ability to optimize the monitoring approach is incorporated when writing the monitoring plan.
In addition to traditional statistical methods, several software tools are available to help optimize monitoring approaches. For example, MAROS, GTS, 3TMO, and Summit Monitoring are specifically designed for monitoring network optimization through spatial and temporal sampling reductions. These tools are focused on reductions in long-term monitoring programs. Section 5.7 illustrates the development of a monitoring approach for the Washington Square Mall example (Section 2.5).
5.7 Developing a Monitoring Approach Example Site
The monitoring program supporting an IDSS must be dynamic by nature through the project life cycle. The following example illustrates the development of a monitoring program from functional objectives. Such a monitoring program should be routinely evaluated with respect to the functional objectives to identify when new or revised functional objectives are needed and when sites achieve important milestones that suggest other elements of the IDSS should be reevaluated to maximize the efficiency and value to the site management program.
Figure 5-3 shows the process for developing a monitoring approach for the Washington Square example site. The first step, describe the absolute and functional objectives for the site, is illustrated in Chapter 3, Table 3-3. Section 4.4 describes the second step, identify the selected remedies for the site. The remedy consists of soil removal for the unsaturated source zone and ISCO using permanganate for the saturated plume zone. Step 3 identifies the location, type and quality of samples, techniques, and measurements needed to provide data. The data will be used to assess a remedy’s progress towards achieving its functional objectives. In Table 5-5, the monitoring media, monitoring method, and monitoring location columns are completed based on data and information necessary to evaluate progress towards the functional objective.
In Step 4 the monitoring frequency should be adequate to detect changes in the geochemical conditions and remedial progress at the site. Monitoring frequency varies with site-specific conditions but should be adjusted for evolving monitoring requirements over the life of the remedy. While that frequency may be greater than is typically employed, it should be realized that the higher frequency is required to obtain the data to make informed management decisions while the remedial action is occurring and the frequency can change over the lifetime of a remedy. For example, weekly monitoring may be required during an ISCO treatment, but quarterly monitoring may be used after the treatment to monitor the long-term aquifer response to the treatment. Table 5-5 lists the overall monitoring period as well as potential monitoring frequencies, such as weekly, monthly, or quarterly. For example, monitoring frequency may be decreased if it is determined a remedy is performing as expected and very little change is observed from one monitoring period to the next, or it may be increased if unexpected conditions occur or the effects of remedy modification need to be observed more frequently.
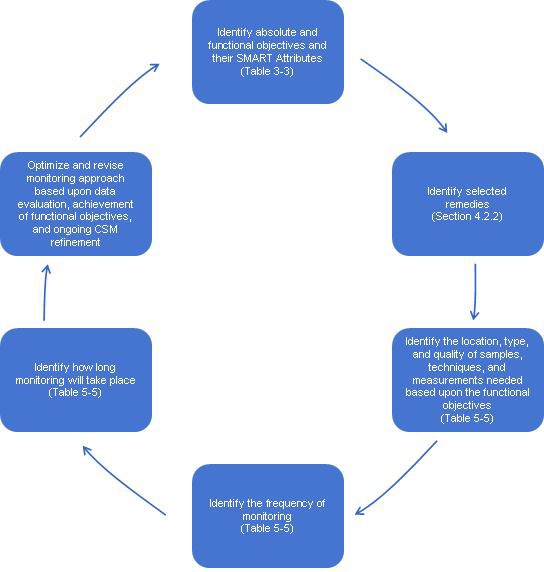
Figure 5-3. Developing a monitoring approach for the Washington Square Mall example site.
The fifth step is to identify how long monitoring will take place. Again in Table 5-5, the monitoring will take place for 24 months since this was the time frame established for achievement of the SMART functional objectives in Table 3-3. For many remedies involving restoration of groundwater to beneficial use, the monitoring period extends past that point in time when groundwater cleanup levels are achieved and the remedy is shut down to verify the exposure threat is eliminated and demonstrate “rebound” will not occur. This period of time is usually determined by regulatory authority.
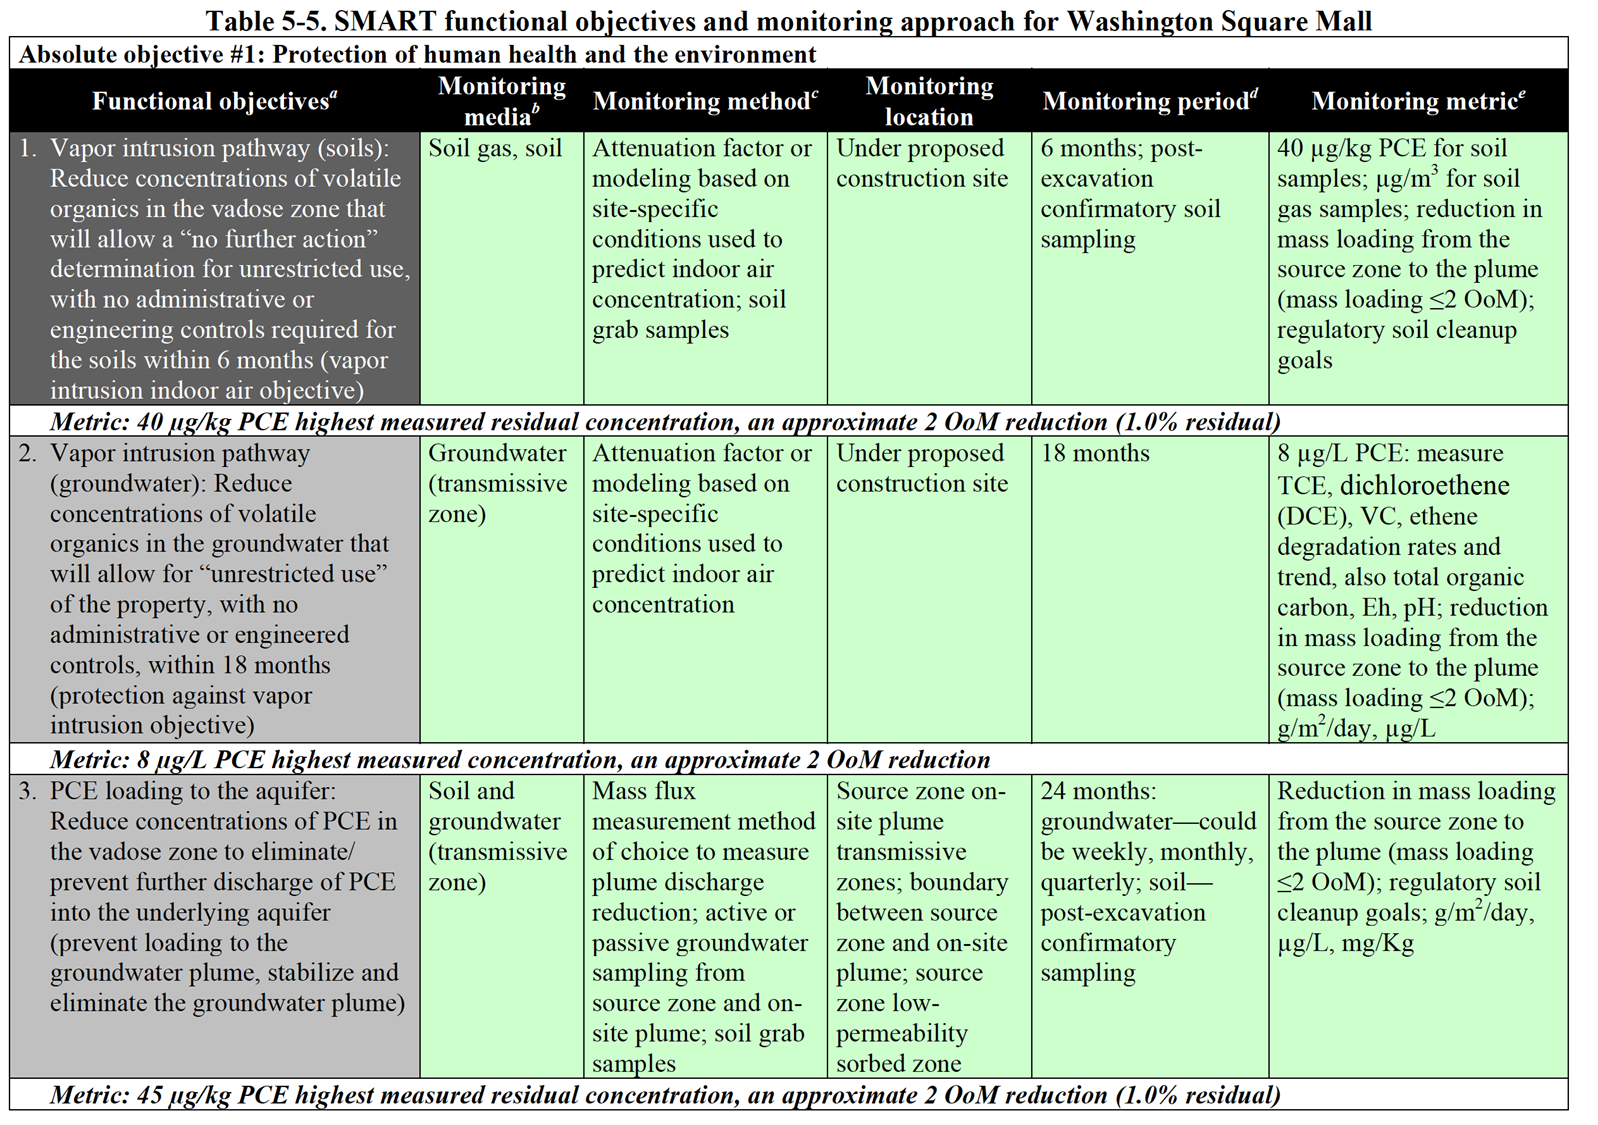
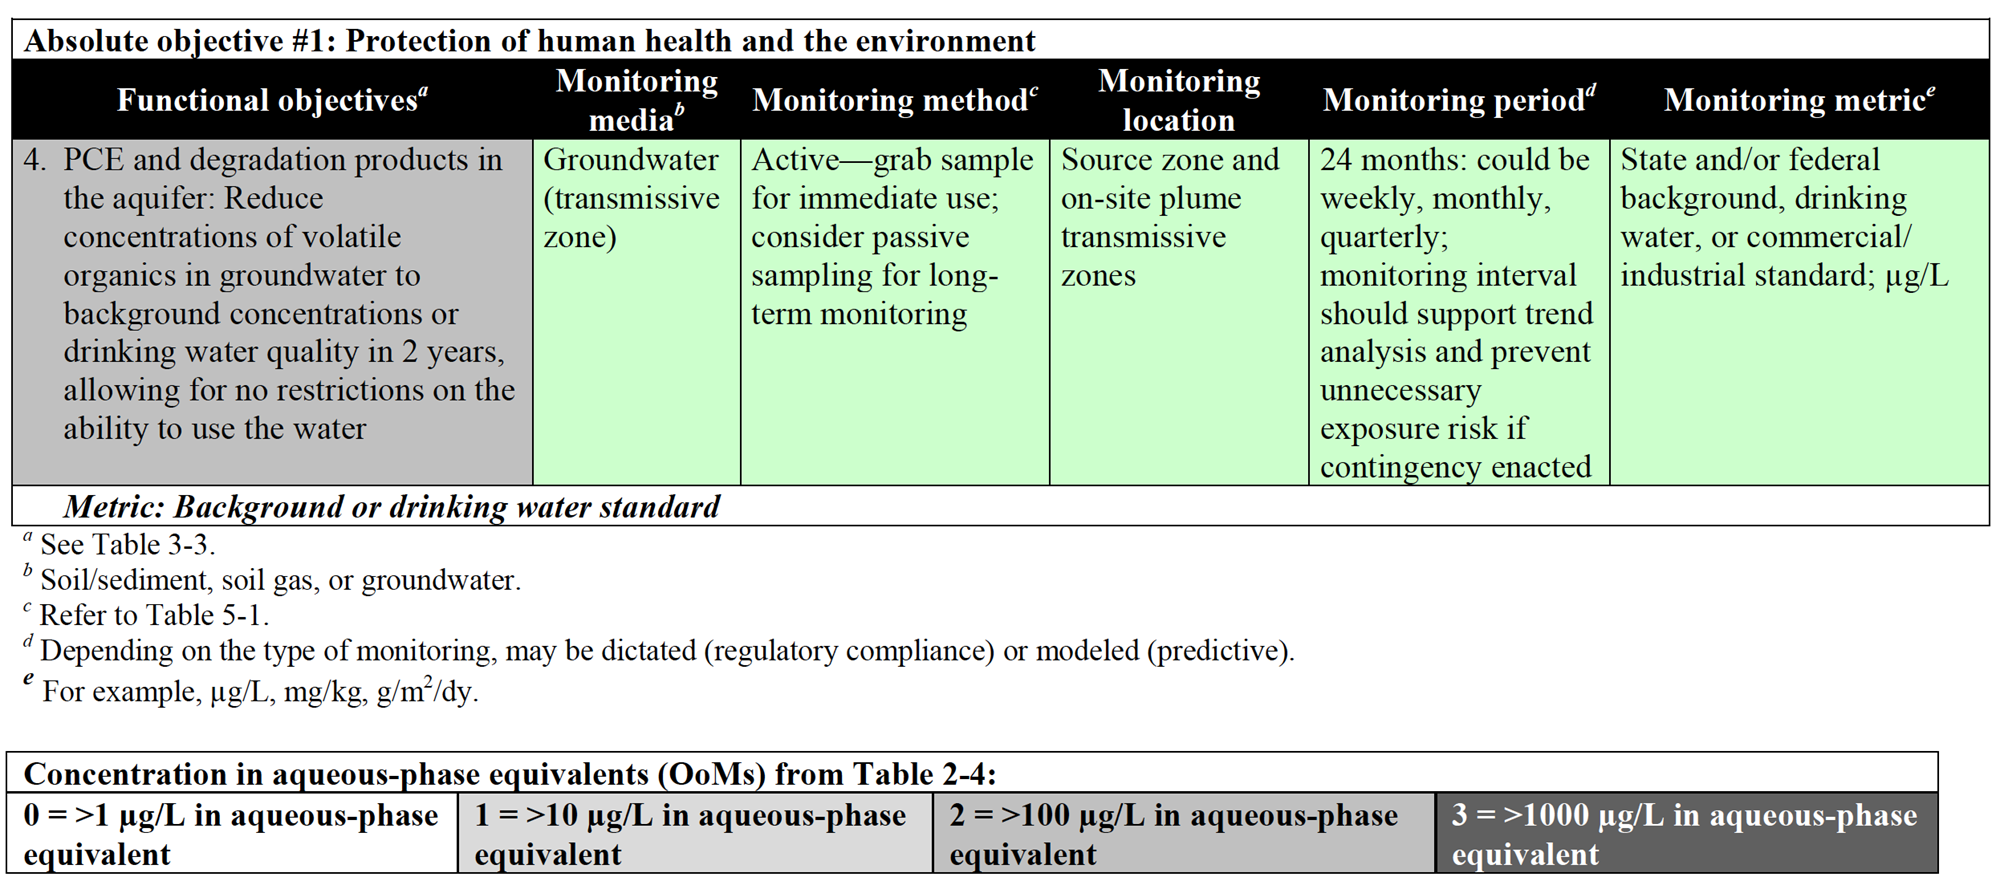
To summarize; the Washington Square Mall has been characterized (Chapter 2), the remedial functional objectives have been defined to accommodate the attributes of SMART (including the addition of interim functional objectives, Chapter 3), technologies have been selected and performance expectation defined (Chapter 4), and a monitoring approach has been established that defines the media in which to monitor the preestablished metric, the method(s) used to monitor the metric, the location of the monitoring system, the initial monitoring period or interval, and the initial duration of monitoring (Chapter 5). What remains is what most project managers find most troubling and where most site remediation projects unravel. In Chapter 1 the fifth key area of this guidance reevaluating the strategy repeatedly and even modifying the approach when objectives are not being met or when alternative methods offer similar or better outcomes at lower cost requires attention to several rather simple questions:
- Are your functional objectives being met?
- Is progress toward functional objectives acceptable?
- Can objectives be achieved with greater efficiency?
- How do you troubleshoot the remedy if objectives are not being achieved?
Simple questions, yet few sites have developed an IDSS from the initial discovery of the site and consequently have not adequately addressed one or more of the first four keys areas discussed in Chapters 2–5. Returning once again to Chapter 1, to “…maximize the chances for successful outcomes related to chlorinated-solvent site management and cleanup,” a site needs to have the following:
- a conceptual site model based on reliable characterization methods and an understanding of the subsurface conditions that control contaminant transport, reactivity, and distribution
- remedial objectives and performance metrics that are clear, concise, and measureable
- treatment technologies applied in sequence or in parallel designed to optimize performance and take advantage of potential synergistic effects
- monitoring strategies based on interim and final cleanup objectives, the selected treatment technology and approach, and remedial performance goals
Using the Washington Mall example, this guidance has illustrated the keys points in each topic that experienced practitioners, consultant, and regulators can use to manage a chlorinated solvent–contaminated site. Before going into the fifth and final key point from Chapter 1, review Appendix B, which illustrates the entire approach to developing an IDSS using another, more complex example. This appendix enables readers to follow an illustration of all the key points of Chapters 2–5, uninterrupted, using a single example.
Following review of the Appendix B example, Chapter 6 describes an approach to evaluate progress toward functional objectives and make positive decisions about the remedy, CSM, and remedial objectives.


