As described in Chapters 2–5 of this guidance, the four elements of developing an IDSS for chlorinated solvent sources and plumes include the following:
- conceptual site model based on reliable characterization methods and an understanding of the subsurface conditions that control contaminant movement and distribution
- remedial objectives and performance metrics, based on realistic assumptions and expectations
- treatment technologies applied in sequence or in parallel, based on each one’s optimal niche and potential synergistic effects
- monitoring strategies based on interim and final cleanup objectives, the selected treatment technology and approach, and the remedial performance goals
This appendix applies each of these four elements to a more complex example site (modified from an example in Sale and Newell 2011) to illustrate how each contributes information to the development of an IDSS. At the end of the example, alternative outcomes are presented to illustrate how changes to a limited number of parameters may change the outcome, illustrating the flexibility of the IDSS process in developing alternative solutions.
B.1 Site Description
The site in this example is a large industrial facility where piping on a storage tank failed, allowing the rapid release of approximately 10,000 gal PCE into a thick, highly heterogeneous alluvial fan deposit containing interbeds of moderately to poorly sorted silt, fine sand, and coarse sand. Residual DNAPL, representing nearly 60% of the original release, still resides in the vadose zone and groundwater beneath and near the source area. Over a period of 20 years, a groundwater contamination plume developed and extended from the release area downgradient across the industrial property and into an adjacent residential neighborhood. The release has caused or may cause a number of adverse or potentially adverse exposures that must be addressed, including the following:
- The concentrations of PCE in the groundwater and vadose zone at the industrial site, when modeled, indicate a potential adverse vapor intrusion exposure to workers in buildings overlying and near the source area and above the groundwater
- The industrial facility receives its water supply from a well on the property in which PCE concentrations exceed drinking water
- The area of the spill is currently not occupied, and therefore direct exposure to the contamination in that area does not
- Modeling of the potential for vapor intrusion of VOCs from groundwater in the residential area off site has shown that there is a potential for indoor air to contain concentrations of VOCs above a de minimus level (1 × 10⁻⁶ incremental cancer risk and hazard index of 1).
- PCE concentrations exceed the drinking water standard (5 µg/l) in groundwater contamination In addition, VOCs exceed drinking water standards in a water supply well within the downgradient plume. There are no other water supply wells within the plume area or within 2 miles of the leading edge of the plume.
These real and potential exposures are incorporated into the CSM and used to establish functional objectives as presented below.
B.2 Site Conceptual Model
Figure B-1 provides plan view and cross-sectional representations of the site. The source area and plume are approximately 4400 feet long. The top of the water table is 20 feet bgs. The depth to the base of PCE contamination varies 40–60 feet bgs. The plume is aerobic, and the absence of PCE degradation products suggests that there is little, if any, natural degradation of PCE occurring. The apparent transport velocity of the plume is 1 mile in 20 years, or approximately 260 feet/year. The attenuation of aqueous-phase PCE concentrations with distance is attributed to the combined effects of sorption in transmissive zones and storage of dissolved- and sorbed- phase contaminant in low-permeability zones. Contaminant storage in low-permeability zones is shown graphically by low-permeability interbeds (lenses with dashes) that have higher concentrations at their margins than in their interiors. The figure legend defines the aqueous- phase equivalent concentrations represented in figure. See Section 2.5.2 for a description of the use of aqueous-phase equivalents to represent conceptualized distribution of contaminants using the 14-Compartment Model.
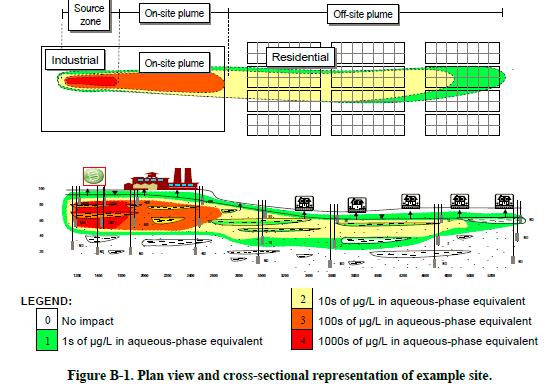
Figure B-1 splits the release into a source zone, an on-site plume, and an off-site plume. The subdivision of the plume is necessitated because of different on- and off-site exposure scenarios, accessibility, plume concentrations, absolute and functional objectives.
B.3 Mapping Contaminant Distribution and Fluxes
Figure B-2 uses the 14-Compartment Model to depict aqueous-phasecontaminant distribution and contaminant concentration in orders of magnitude as defined in the Figure B-1 legend (aqueous-phase equivalent as described in Chapter 2). According to Section 2.4.1, this site is a middle-stage site. Note that the 14-Compartment representation in Figure B-2 has been modified to include separate sets of transmissive and low-permeability compartments for the on- and off- site plumes. The aqueous- and vapor-phase concentrations in transmissive zones in Figure B-2 were developed from available water quality and soil gas data. The concentrations in the remaining compartments were based on anticipated partitioning among the four phases (arrows) and between the transmissive and low-permeability zones per the processes described in Chapter 2. Unfortunately, as is typical of many sites, no data were available from low-permeability zones. Thus, development of a 14-Compartment Model can help identify critical data gaps (e.g., improved mass distribution) and decisions regarding collection of additional data.
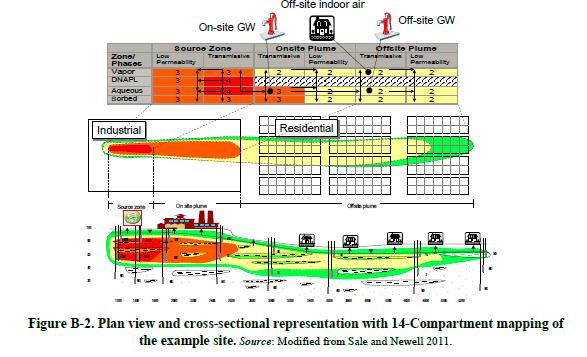
Figure B-2 also shows the critical points where human exposure most likely will occur (off-site indoor air depicted by the house icon and on- and off-site drinking water well depicted by the well icon).
B.4 Site Remedial Objectives
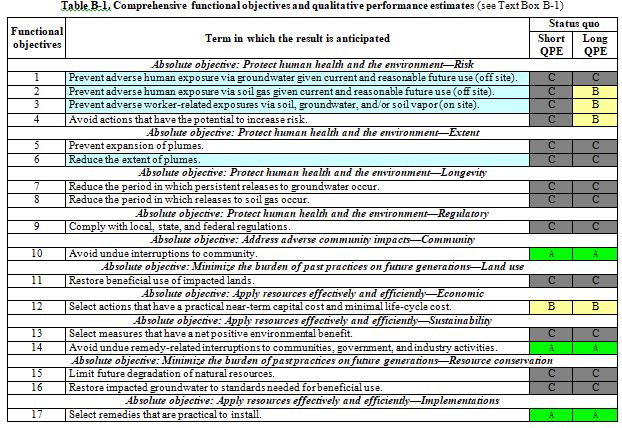
Table B-1 lists site-wide hypothetical functional objectives supporting these five absolute objectives. Columns to the right of the functional objectives provide a basis for a qualitative ranking, based on Qualitative Performance Estimates (QPEs), defined Text Box B-1, of how well an action or set of actions meets the functional objective in the “short” term (a few years) or “long” term (a decade or more). Included as an option is “no clear benefit.” For this example, the status quo (no clear benefit) includes no active groundwater use and vapor mitigation beneath homes which exceed indoor air standards. Pragmatically, any new set of actions should result in a consequential improvement over the status quo.
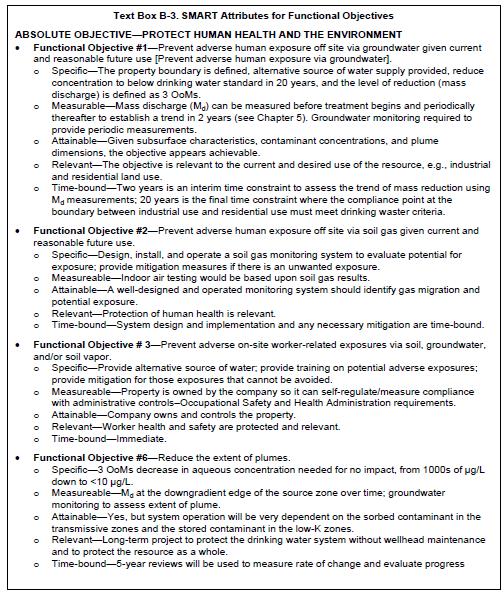
At this point, the functional objectives have not yet been assigned SMART attributes. Applying the SMART criteria to the functional objectives requires that we limit the SMART application to those functional objectives that require action to drive the remediation toward protection of human health and environment (see real or potential exposure in Section B.1). Those functional objectives are highlighted in light blue in Table B-1. As discussed in Chapter 3, the remaining functional objectives in Table B-1 are not discarded but are considered in the development of SMART Functional Objectives 1, 2, 3, and 6. Section B.5 describes the process followed to ensure that Functional Objective 1, 2, 3, and 6 are modified to accommodate the SMART attributes.
SMART Objectives
The functional objectives described in Table B-1 are still general. As described in Chapter 3, functional objectives should meet the SMART attributes. Development of SMART attributes for each functional objective more accurately describe the potential for successful remediation of part or all of the contaminated site. Development of SMART functional objectives is difficult and dependent on the reliability of the CSM. Attempting to make all functional objectives in Table B-1 “SMART” is probably impractical in this example. This exercise is limited to those objectives that directly contribute to site remediation. Accordingly, Functional Objectives 1, 2, 3, and 6 are selected as to illustrate the process for applying the SMART attributes.
Making functional objectives SMART often requires that the objective be revised and/or divided into interim functional objectives and final functional objectives. For example, the team of stakeholders originally defined four functional objectives in support of Absolute Objective #1 (i.e., To protect human health and environment) as follows:
- Prevent adverse human health exposure off site via groundwater given current and reasonable future
- Prevent adverse exposure off site via soil gas given current and probable future
- Prevent adverse on-site worker-related exposure via soil, groundwater, and/or soil
- Reduce the extent of the
As SMART attributes are developed for each functional objective, the objectives are further refined into interim functional objectives (see Table B-2). The SMART interim functional objectives clearly define specific, measureable, attainable, relevant, and time-bound objectives from the immediate time frame through the 20-year remediation schedule. This procedure allows interim reviews of performance to evaluate trends early in the remediation process (2 years) rather than waiting 20 years to determine success or under performance.
Table B-2 illustrates that the four functional objectives each require three to four interim objectives to address separate time-bound elements or allow shorter-term measurement of success. Each interim functional objective contributes to the completion of the final functional objective, and each final functional objective contributes to the completion of the absolute objective, which is to protect human health and the environment.
Table B-2 provides a checklist of positive answers to the consideration of SMART attributes for Functional Objectives 1, 2, 3, and 6. The determination that they do or do not adhere to SMART attributes requires a short description of the basis for that determination. Text Box B-3 documents this basis for claiming SMART attributes apply to each final functional objective.
Table B-2
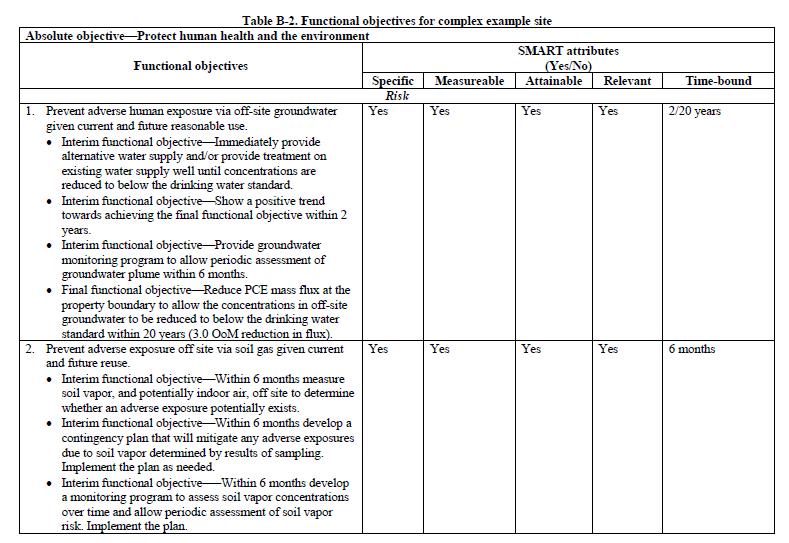

During implementation, failing to achieve any of the interim functional objectives (e.g., show a positive trend toward achieving the final functional objectives within 2 years) or final Functional Objective #1 (e.g., reduce PCE mass flux at the property boundary to allow the concentrations in off-site groundwater to be reduced to below the drinking water standard within 20 years
(3.0 OoMs reduction in flux) provides data by which the original decision is reevaluated or, more importantly, the functional objective is refined. Failing to achieve an interim or final functional objective triggers an evaluation of the information known before remediation began, the assumptions regarding the site or the remedial design, and the performance predictions for the original remedial approach. It may become clear that the CSM needs additional detail (Chapter 2) or the technology(ies) may need to transition to another technology or technology combination (Chapter 4) to improve treatment performance before modification of the functional objective is considered. Regardless, it is likely that the additional information gathered since the original functional objectives were established and the original remedial actions or treatments were developed will change the original CSM, which in turn will identify remedial design or operational inadequacies.
B.5 Development of Remedial Measures
Selection of remedial measures is an iterative process where options are proposed, performance is predicted, and complementary measures are added to address limitations of the basic method. The first step in this process is development of a “first cut” set of actions (remedies) that will likely be employed and, conversely, other actions that are unlikely. For this example, elements that are likely and unlikely include the following:
- land use restrictions that preclude future use of groundwater in the impacted area for the foreseeable future (Functional Objectives 1 and 3)
- maintenance of vapor mitigation at all homes where a potential for adverse impacts related to the site exists (Functional Objective 2)
- long-term monitoring to verify the continued protectiveness of the site remedy
- continuing supply of an alternative source of water or treatment of existing contaminated supplies, both on and off site, until contaminant concentrations allow use of the water once again (Functional Objective 1)
- maintaining mitigation measures designed to protect on-site workers from adverse exposure to contaminants in soil and soil vapor (Functional Objective 3)
Unlikely:
- measures that would preclude continuing habitation of impacted homes
- measures that would cause the industrial facility to close
For this example, we assume that the interested parties propose two divergent options for dealing with the source area:
- source depletion via in situ thermal treatment
- source containment via a bentonite slurry wall and low-flow hydraulic containment
Figure B-3 predicts the outcome of source depletion. The anticipated performance is based on the conditions identified in Figure B-2 and a map of technology performance for in situ conductive heating in Figure B-3. One variation is the predicted result that an order-of-magnitude reduction in aqueous concentrations in transmissive zones in the plume will yield 1 OoM reduction in vapor concentrations in transmissive zones of the on-site plume, reinforcing the fact that anticipated performances for technologies are guides (see Section 4.1.1), not fixed results.

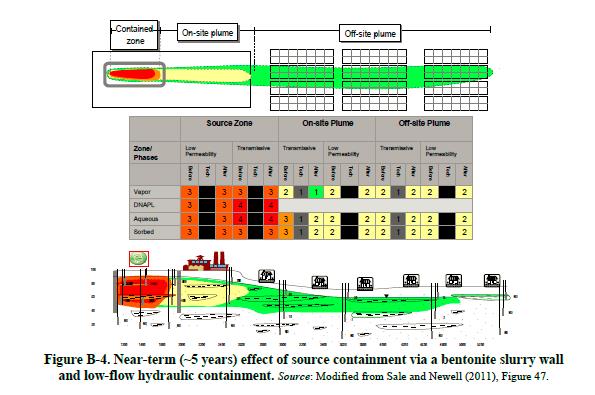
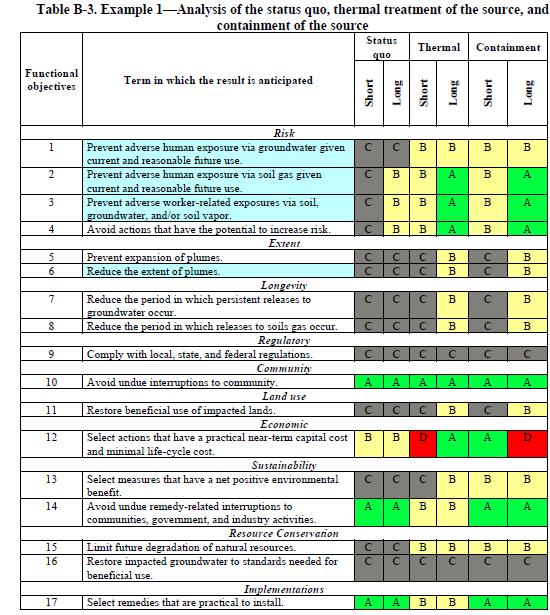
Figure B-4 predicts the outcome for source containment. Anticipated performance is based on the conditions identified in Figure B-2 and application of bentonite slurry walls and low-flow pumping. From a performance perspective, the primary difference between the two options is that thermal treatment depletes the source, while containment and pumping has little effect on contaminants in the source zone. From an order-of-magnitude perspective, both options have similar results in on- and off-site plumes. Table B-3 provides further insights regarding the merits of the options.
Other differences between the options are that thermal treatment may have a higher initial capital investment yet shorter treatment period, resulting in a lower life-cycle cost, and may disrupt site activities during the first year (see Chapter 4). Conversely, containment and hydraulic control may have a higher life-cycle cost and extended liability due to long-term O&M. Containment will also cause site disruption during barrier installation (first year) and maintenance (out years). Containment will also be an obstacle to construction of site infrastructure that would cross the barrier itself. A limitation of both source depletion and source containment is that any downgradient effect is slow and difficult to predict, and only gradual improvement in aqueous and vapor concentrations in the off-site plume will be achieved.
Considering the analysis in Table B-3, modifications to the thermal source treatment and containment include the following:
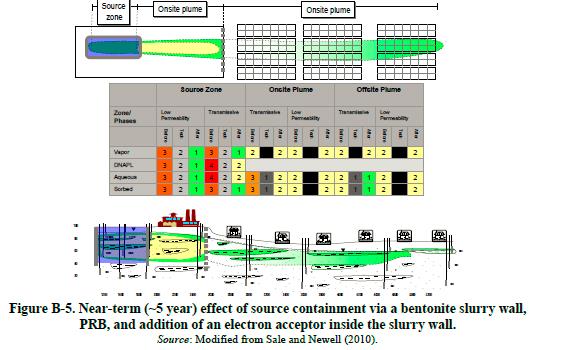
- An iron PRB (Section 4.1.4.3) can be added at the downgradient edge of the on-site plume. This can be expected to reduce the time required to realize improvements in aqueous- and vapor-phase concentrations in the off-site (residential) plume. The iron PRB can complement either the thermal or containment
- An electron donor (e.g., emulsified vegetable oil ISB, Section 4.1.3.3) can be injected upgradient of the bentonite slurry wall. Biological treatment can be expected to reduce or even eliminate ongoing hydraulic controls inside the containment zone and, in the long term, reduce contaminant concentrations in the source
With these modifications to the IDSS system, the performance of both options remains similar within an order of magnitude. Figure B-5 predicts the outcome of enhanced options, referred to as Containment Plus (electron donor and PRB) and Thermal Plus (PRB). This estimates a 1 OoM improvement in the transmissive zone of the off-site plume. It does not address the potential exposure to on-site workers; therefore, land reuse and the on-site drinking water well remain a long-term issue to be resolved and can affect the value of the industrial complex. Lastly, Table B-4 compares the expected performance for the status quo, Thermal Plus, and Containment Plus. Similar outcomes are expected for both options; however, Containment Plus should have a lower initial capital cost and better accommodate the ongoing industrial land use.
More active treatment of the off-site plume is possible; however, higher off-site activity levels may disrupt or even alarm off-site residents. Conversely, less-active treatment may require an extension of the 20-year projected completion date for protection of the off-site drinking water well. However, it must be acknowledged that predications beyond 20 years can be unreliable, and our knowledge base is constantly changing (see Chapter 3).
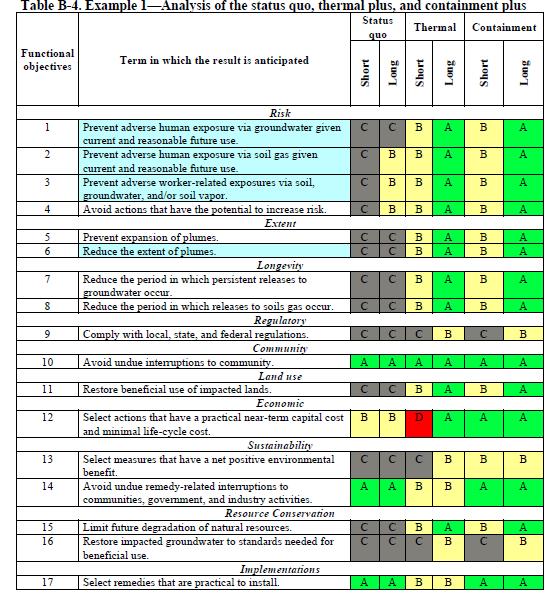
Remedial measures were developed through an iterative process. Outcomes of the proposed actions were predicted for all approaches using the 14-Compartment Model. Both approaches provide substantial improvements over the status quo with respect to imminent or already completed exposure pathways. At the same time, the slurry wall containment and treatment option leaves contaminants in places that will be addressed only by historically slow natural attenuation processes. In the end, this solution can be implemented only if all stakeholders agree on the value of what will be achieved versus the cost to manage the risks that remain.
B.6 Reevaluating an Underperforming Site Strategy
| Text Box B-4. Containment Plus Remedial Option (see Figure B-5) A bentonite slurry wall was emplaced and has been operational for 4 years in addition to the low-flow hydraulic containment system. Emulsified vegetable oil was injected into the subsurface within the containment wall to accelerate treatment. A downgradient ZVI PRB was put in place ~3.5 years ago. |
The example explored in Chapter 6 is used below to illustrate how an underperforming remedy is reevaluated using the process described earlier in this chapter. From Chapter 6, after semiannual monitoring of the “containment plus” remedial option (see Text Box B-4), results from the source are as follows:
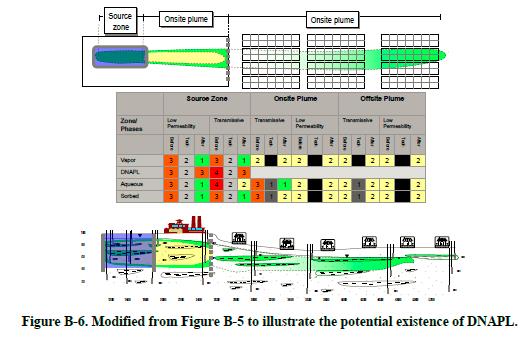
- TCE (the primary source contaminant) is still present at 1%–5% of solubility a concentration indicative of the presence of DNAPL (Figure B-6 shows both low- permeability and transmissive zones are still above
100s of µg/L TCE), though DNAPL, once frequently observed, has not been detected for more than 2 years.
- Concentrations of TCE have been monitored quarterly in groundwater from the low-flow hydrodynamic control that backs up the slurry wall. However, monitoring events coinciding with two periods of excessive precipitation, there has been no observable TCE
Results within the downgradient dissolved plume indicate the following:
- COC trends upgradient of the PRB initially showed a substantial decline but have been at persistent, relatively low concentrations (<0.5 ppb) over the last 2
- COC trends in groundwater immediately downgradient of the PRB have been substantially reduced and are currently not detected.
- However, COC concentrations at the distal portion of the plume downgradient of the PRB have largely remained unchanged, likely due to back diffusion (see Figure B-6). Aqueous concentrations in this area remain at 10s of µg/L
B.7 Response to an Underperforming Remedy
The functional objective for human exposure to off-site groundwater contaminated with TCE (Functional Objective #1, Table 3-1) is predicated on a 20-year treatment time frame for full compliance, with an interim time frame of 2 years to demonstrate a positive trend toward drinking water criteria. Given that the groundwater velocity has been estimated at approximately
260 feet/year and the distance from the PRB to the compliance monitoring point is approximately 3000 feet, the impact of the PRB would not be seen downgradient in less than 11– 12 years without the exacerbating effects of back-diffusion and desorption.
Four years is not sufficient for any changes due to treatment to be seen at the compliance well. However, given the long period of time between treatment and observations at the compliance well, there is now concern that if anticipated reductions in concentrations are not achieved in the 11–12 year time frame at the distal end of the plume compliance point, there is not sufficient time to make adjustments to achieve goals within 20 years. In addition, given the plume response to the source treatment, diffusion of contaminants from low-permeability zones may make achieving goals at the compliance point. Options in response to the monitoring information include the following:
- Reevaluate the CSM to determine the potential mass storage in the on- and off-site low- permeability zones. The apparent assumption from Section B.3 (“The concentrations in the remaining compartments were based on anticipated partitioning among the four phases [arrows] and between the transmissive and low-permeability zones per the processes described in Chapter 2. Unfortunately, as is typical of many sites, no data were available from low-permeability zones.”) is inaccurate. Additional data collection and refinement of the CSM are required to assess mass storage in the low-permeability zones in the on- and off-site plumes.
Reevaluate objectives
- A reevaluation of the original objective indicates that this objective is not realistic given that the interim goal was to observe a contaminant reduction trend within 2 years but the measurement point is located 11–12 years travel time away from the treatment area. Therefore, either an interim monitoring well should be placed within 2-year travel time of the treatment location or treatment should be conducted at a point of the plume that is within 2 years’ travel from the compliance
- Based on the reassessment of mass storage, the time frame for Functional Objective # 1 should be reassessed. A time frame beyond 20 years requires reconsideration of the technologies applied in the plume, preferably the distal end of the plume, should be treated to protect the drinking water well and achieve
- Reevaluate technologies—Table B-5 compares the predicted and actual performance of the remedial technologies to date. Although the PRB has effectively stopped contaminant mass flux from the source to the off-site plume, back-diffusion of contaminants from low- permeability zones may (a) extend the time that contaminant flux discharges from upgradient of the PRB and (b) mask the positive effect in the downgradient contaminant plume for some period of time at compliance wells. Given both of these considerations, the PRB may need to be operated for much longer than planned. Given the limited effect of the PRB on contaminants in low-permeability zone, an evaluation of technologies for contaminants in low-permeability media could be conducted to establish contingent actions should data indicate that the remedy will not meet
In this example, the functional objectives still appear to be achievable and the existing technologies appear to be performing as designed, but the time frame for treatment may need to be extended due to residual contaminants in low-permeability media. Contingency planning should be conducted to identify alternative courses of action that could be taken to achieve objectives within the desired time frame.


